Monitoring Skype for Business Server (and CCE) in Azure OMS and Power BI
Introduction
As of CCE 2.1.0 there was mention of support for Azure Operations Management Suite (OMS). Being that the CCE is generally left alone once installed, this piqued my interest. Whilst on the whole CCE has been OK to leave to it’s devices, it would be nice to know exactly what it’s doing sometimes. Using OMS we are able to get an insight in to running CCE (and SfB server) installed in multiple configurations and locations in a single place - for someone who manages exactly that, awesome! All of the following article can be done on a CCE of SfB server.
Before we start, there are a couple of articles I’d like to mention first:
- [TechNet article](http://- https://technet.microsoft.com/en-us/library/mt828598.aspx) explaining how to set up a CCE with Azure OMS.
- Following off that article, Martin Boam’s article goes more in-depth on how to set up Azure OMS Workspace, install the Agents on the CCE and configure the reporting Microsoft recommends in the TechNet article. Worth a read.
Creating an Azure OMS Workspace
As the two articles mentioned do a good job of setting this up, I’m not going to go in to massive detail, but a quick run through doesn’t hurt:
-
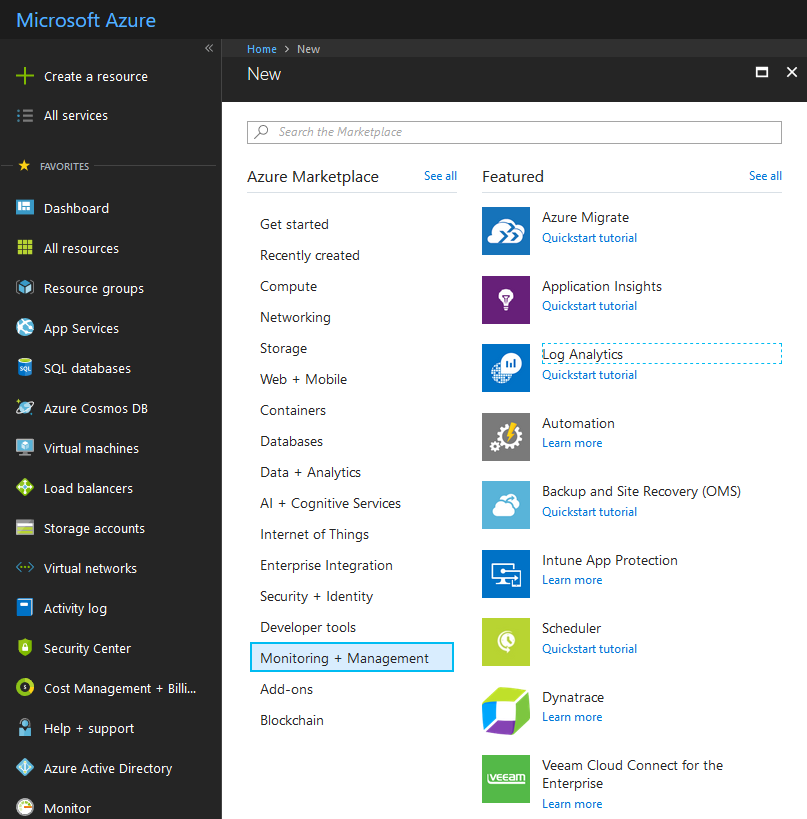
Sign in to Azure portal (create an account if you don’t have one) and go to Create a resource-> Monitoring and Management -> Log Analytics.
-
If you don’t have a OMS Workspace already created, create one. Select the relevant subscription and resource group to use:
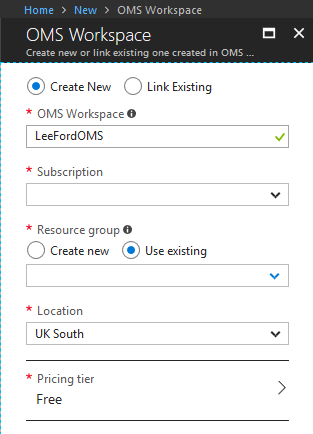
Edit 04/07/18 - (The Free Tier is no longer available, instead select the Standard Tier which includes the first 5GB per month free (£2.15 per GB after) and as long as you keep the retention at 30 days, no retention fees).
3. Once the OMS Workspace has been created, find it under the resource group. Then select OMS Portal.
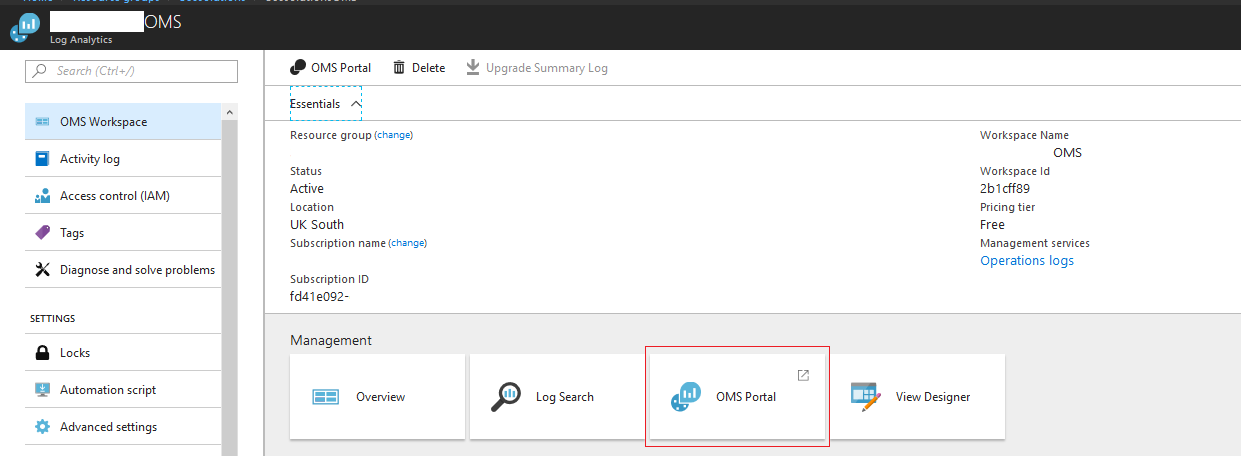 4. Now we’re in the OMS Portal we need to click the Settings cog at the top and navigate to Connected Sources ->Windows Servers. Keep this page open as we will need the “Workspace ID” and “Primary Key” next.
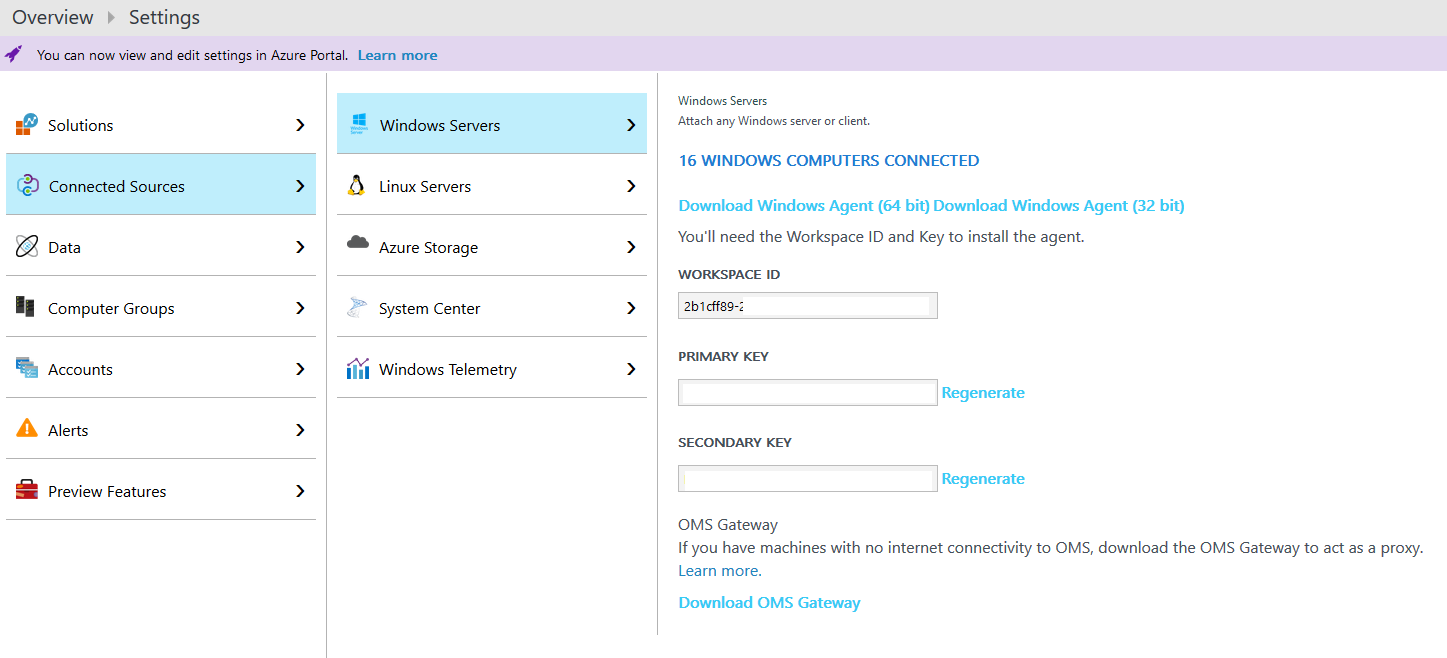
Install the OMS Agent
At this point it depends on whether we are monitoring a CCE or SfB server - the installation steps are a little different.
CCE:
-
Change .ini file:
-
If you are deploying a new CCE, make sure OMSEnabled=false is changed to OMSEnable=true in the CloudConnector.ini file before you start the installation.
-
If it’s an existing CCE that is running 2.1.0, check the .ini file, it might not have the OMSEnabled attribute if its been upgraded from a previous release, so add it under the [Common] section.
-
If it’s a new CCE, continue with the installation. If it’s an existing CCE, run Import-CcConfiguration.
-
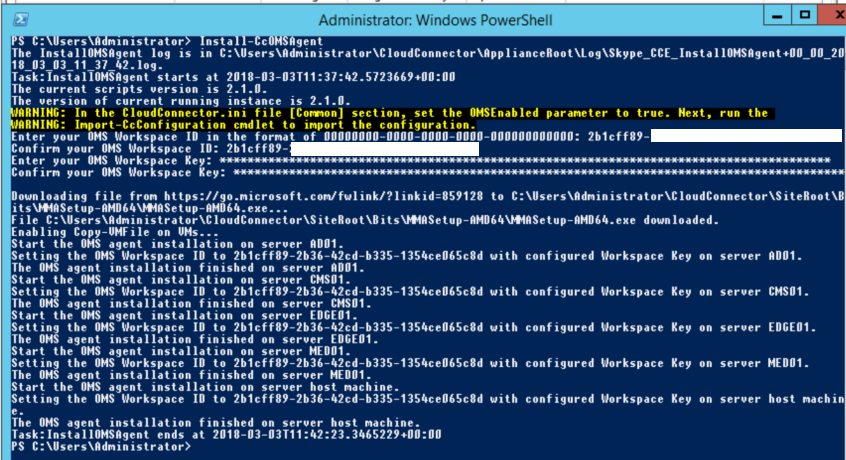
When the CCE is running normally on 2.1.0, run Install-CcOMSAgent.
-
You will be prompted to enter the “Workspace ID” and “Primary Key” from the OMS portal. Enter these and wait a good 5-10 minutes. I have had it get stuck installing the Agent on a VM mid-install, but if it does, just rerun the command again.
-
Once complete it will have installed the agent on the 4 VMs and the host machine.
Skype for Business Server (needs to be done on each server):
-
From the Settings -> Connected Sources -> Windows Servers page you will see an Agent download link. Download the 64bit Agent.
-
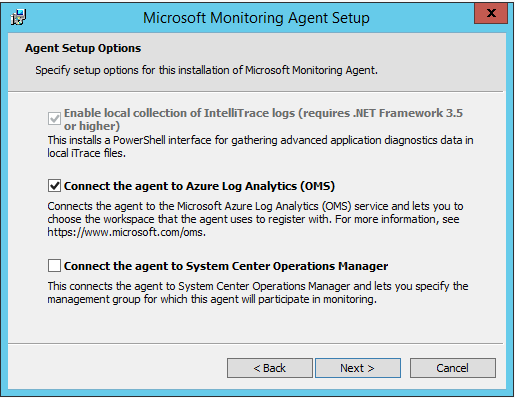
Run the .exe on the server.
-
When prompted, select connect the agent to OMS:
-
Then enter the “Workspace ID” and “Primary Key” and select Azure Commercial. If your server connects via a HTTPS proxy, add this here too:
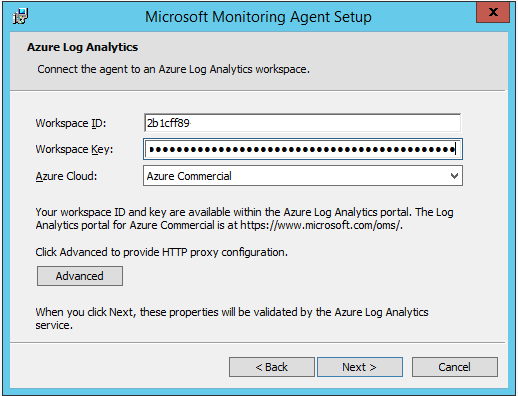
-
Complete the installation.
Confirm the Agents are connected
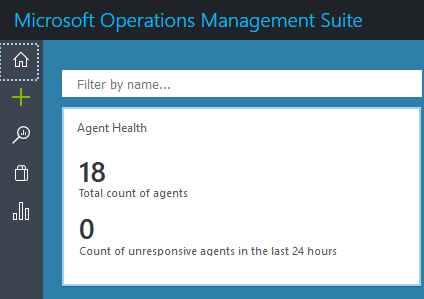
There are multiple ways of doing this, but installing the Agent Health Dashboard is a nice GUI to show the status of all your Agents in one place. You can install this from the Solutions Gallery (shopping bag on the left hand menu).
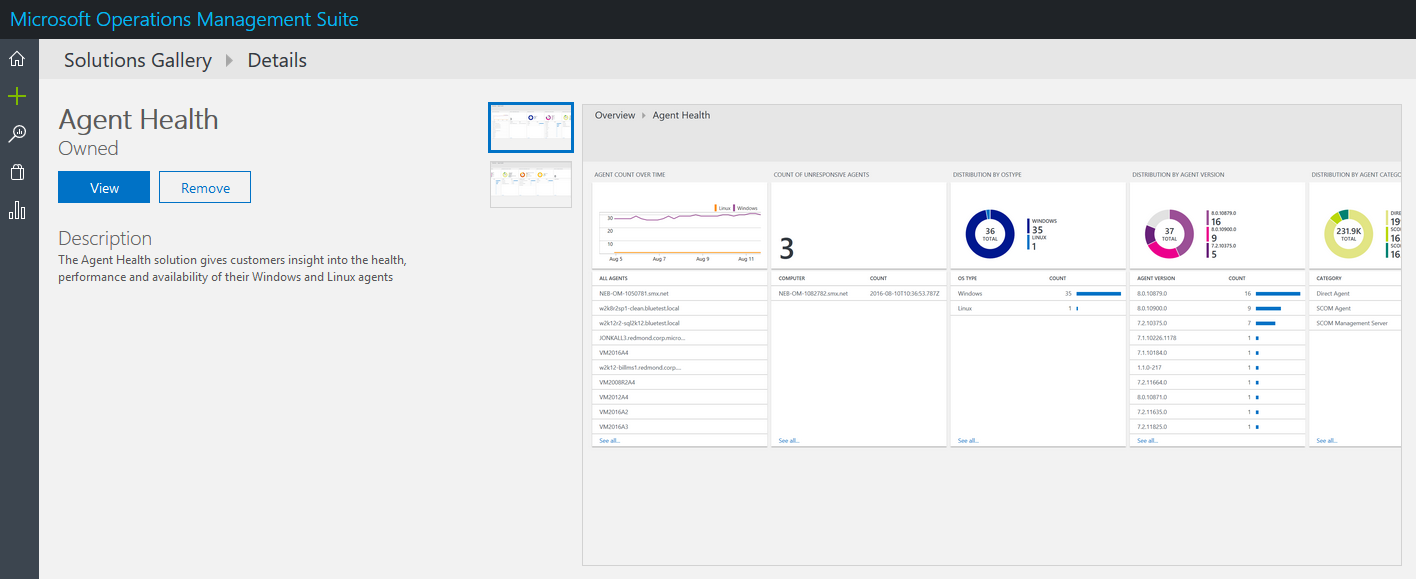
Once installed, it can be access from the Home Page. You can see I have 18 active Agents:
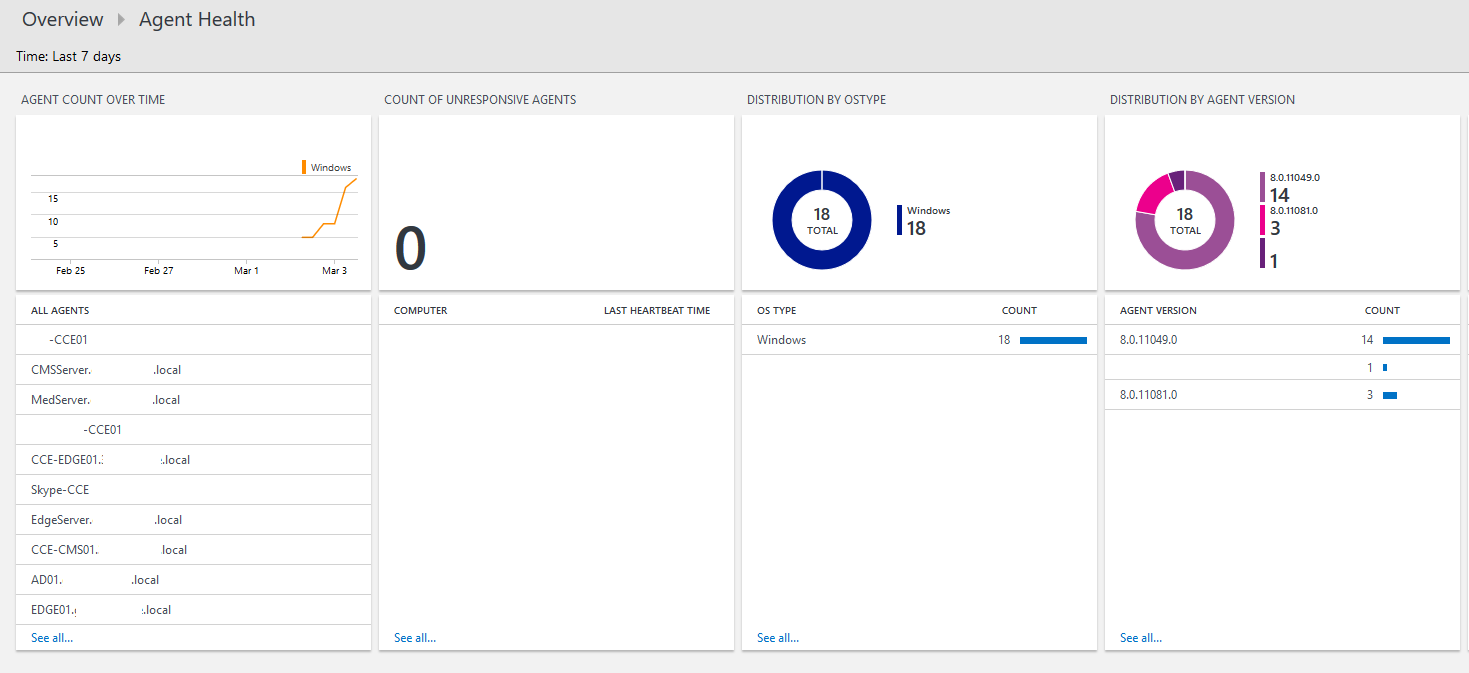
Clicking on the Agent Health box takes you to more information:
Specifying what data to send to OMS
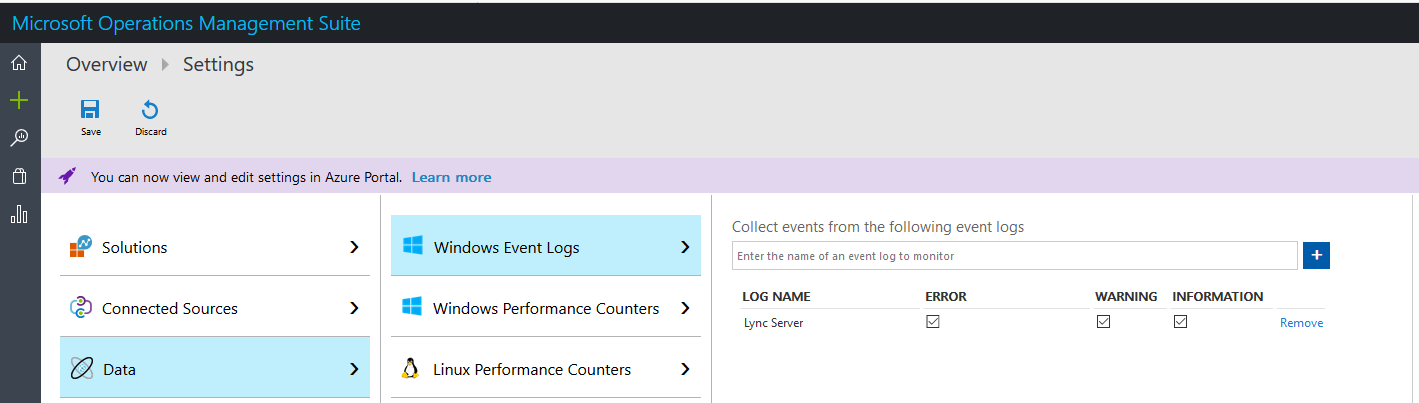
The Agents are now sending heartbeats to OMS, but ideally we want more than that. To do that we need to specify some data to collect. If you navigate to Settings -> Data we can start adding in some data.
First one to add is Windows Event Logs. I’ve spent countless hours in Event Viewer looking at “Lync Server” for clues as to why something isn’t working. Wouldn’t it be cool to have it in one place for multiple instances?
For this article, “Lync Server” logs are sufficient. Note: You will need to type “Lync Server” it will not auto complete. Make sure you click Save afterwards else it will not save.
Next is Performance Counters. You might have used some of these as part of Stats Man. For this article, I’ve added 2 LS specific counters and 3 general counters. The Lync have to be entered manually and will not auto complete.
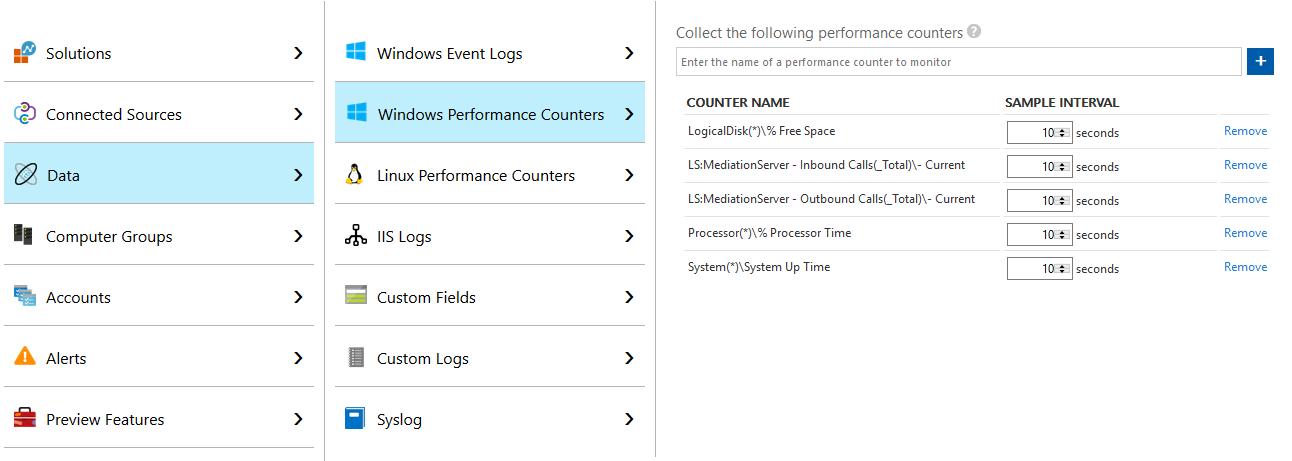
One point worth making is this is the data I’ve chosen to collect for this article, you may want to collect more/less/something else. I’ve also left the sample rate as 10 seconds, but you can adjust how you see fit.
Querying the data (Log Search)
Now we have Agents reporting actual data to OMS, we should start seeing data appear. To access the data and run queries you can use the Log Search tool (magnifying glass on the left hand menu).
Using the OMS query syntax you can query all the data Perf Counters, Events etc. Lets look at an example based off the TechNet article:
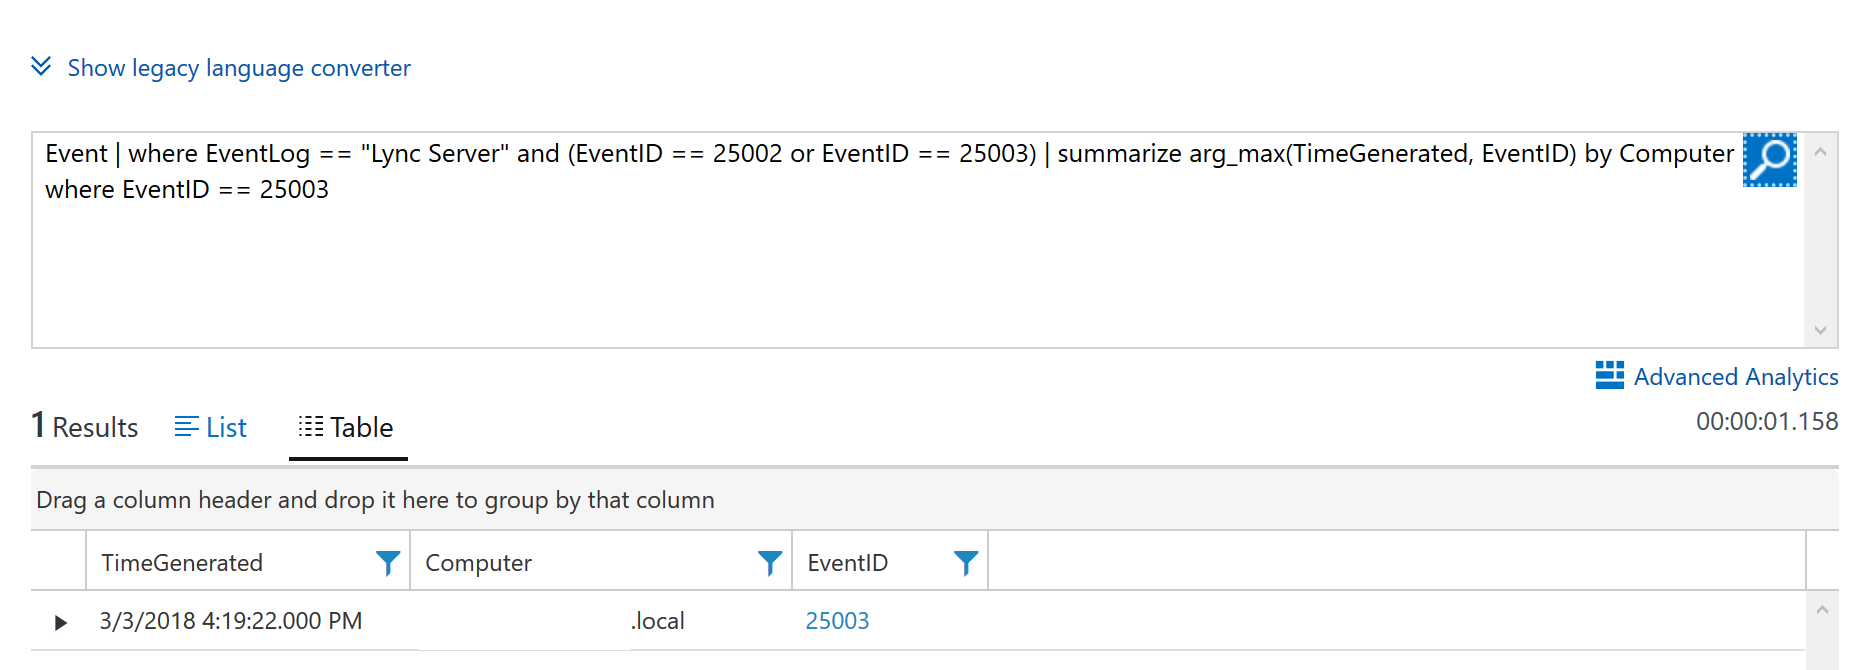
Event | where EventLog == "Lync Server" and (EventID == 25002 or EventID == 25003) | summarize arg_max(TimeGenerated, EventID) by Computer | where EventID == 25003
The examples on the TechNet article have a condition to check the computer contains a name e.g. “mediation”, but in my opinion this is not needed as the Event IDs are specific to the server role - I would want to know if any server raised the Event ID, irrespective of the name. My modified query will check if there is an Event 25002 or 25003 and if the latest result is 25003 (Mediation Service stopped), it will return the Computer(s) that are in this state.
To demonstrate this I disabled Mediation on a Front-End and ran the above query, with one result returned.
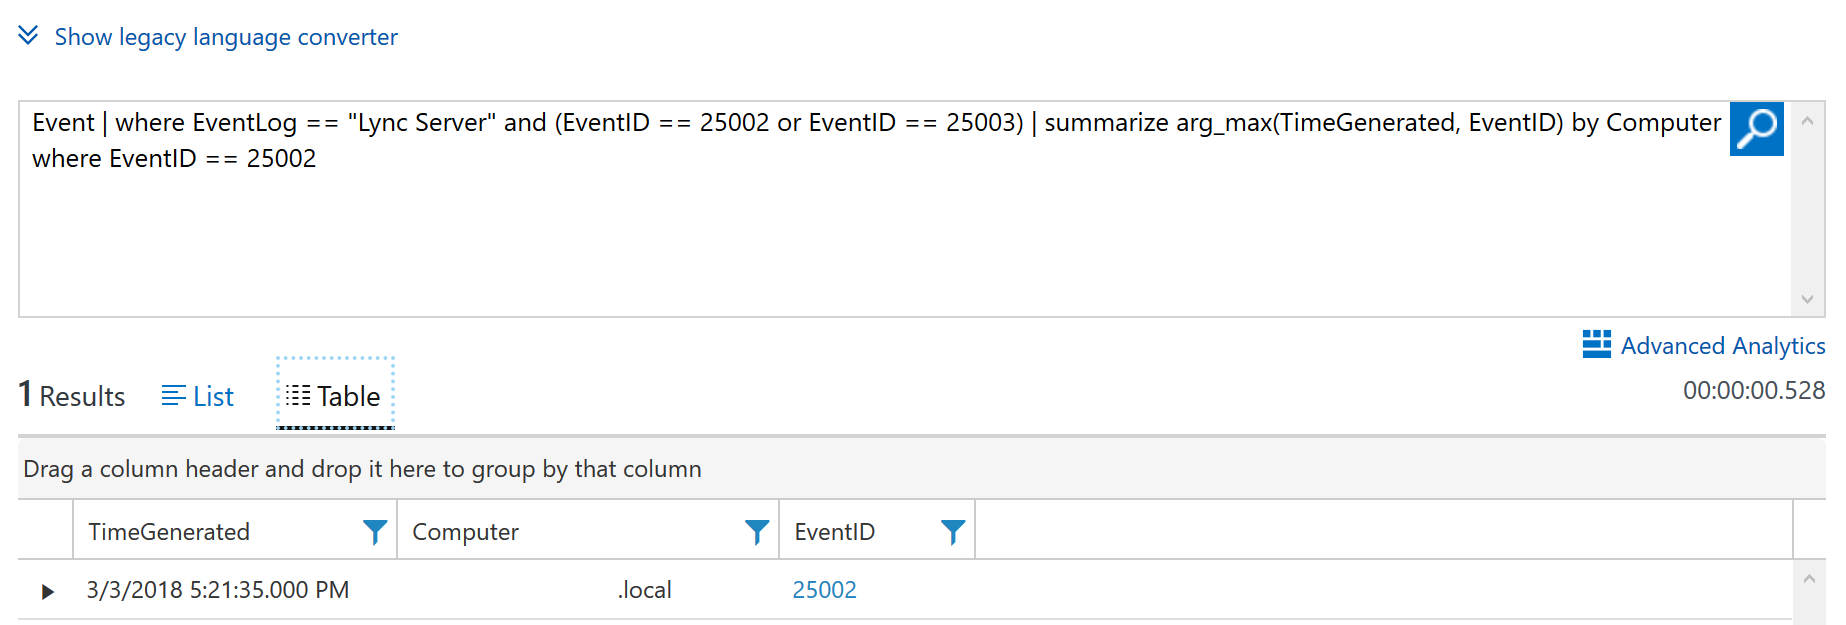
Now with the service running again, I run the query to check if the service has returned to a running state and we get 1 result.
Event | where EventLog == "Lync Server" and (EventID == 25002 or EventID == 25003) | summarize arg_max(TimeGenerated, EventID) by Computer | where EventID == 25002
There are more examples on TechNet about other services stopping and/or Event IDs being triggered, but largely work the same as above.
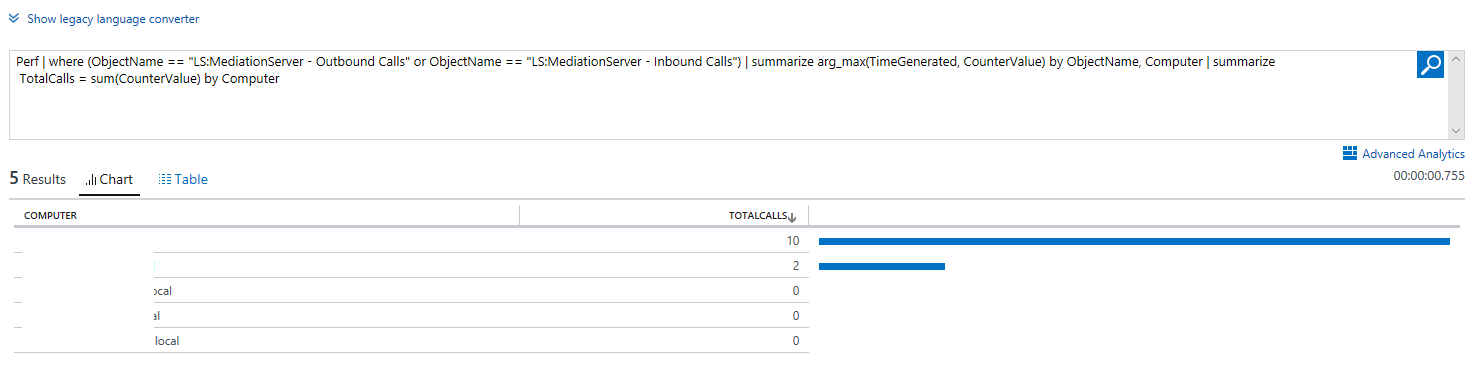
Now, lets run a query based off of performance counters. In this query I’m listing all Mediation Server’s current call volume in descending order:
Perf | where (ObjectName == "LS:MediationServer - Outbound Calls" or ObjectName == "LS:MediationServer - Inbound Calls") | summarize arg_max(TimeGenerated, CounterValue) by ObjectName, Computer | summarize
 TotalCalls = sum(CounterValue) by Computer
In this query, I’m listing the Average Processor % (usage) in descending order:
Perf | where ( ObjectName == "LogicalDisk" ) | where CounterName == "% Free Space" | where CounterValue < 10 | where ( InstanceName == "_Total" )
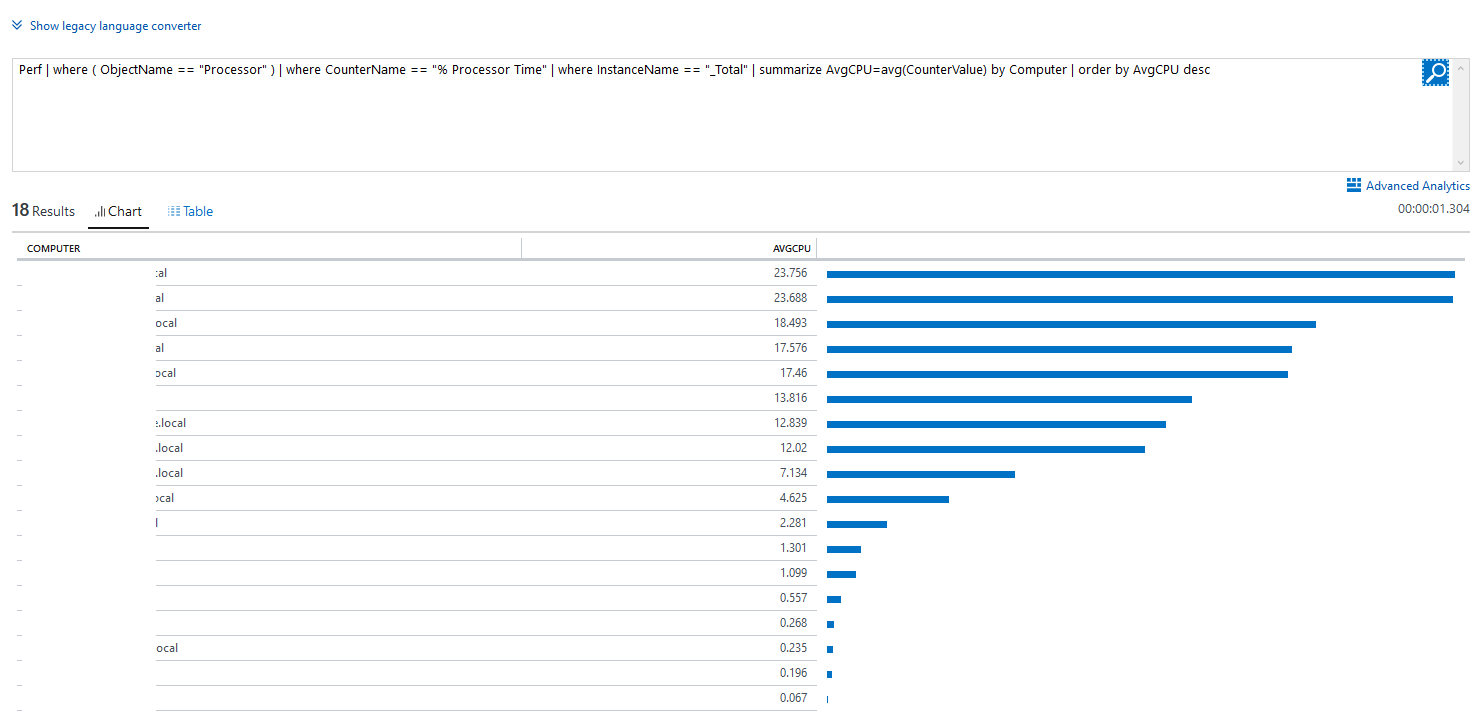
As you can see there is a lot of useful information to be gleaned from performance counters.
Alerts
Whilst we now know how to query for specific Event ID being triggered or performance counters values, ideally we would want to be proactive with these - that’s where alerts come in.
Alerts effectively are constantly running queries (you set how often), so if a query returns a result you specify, if it will fire.
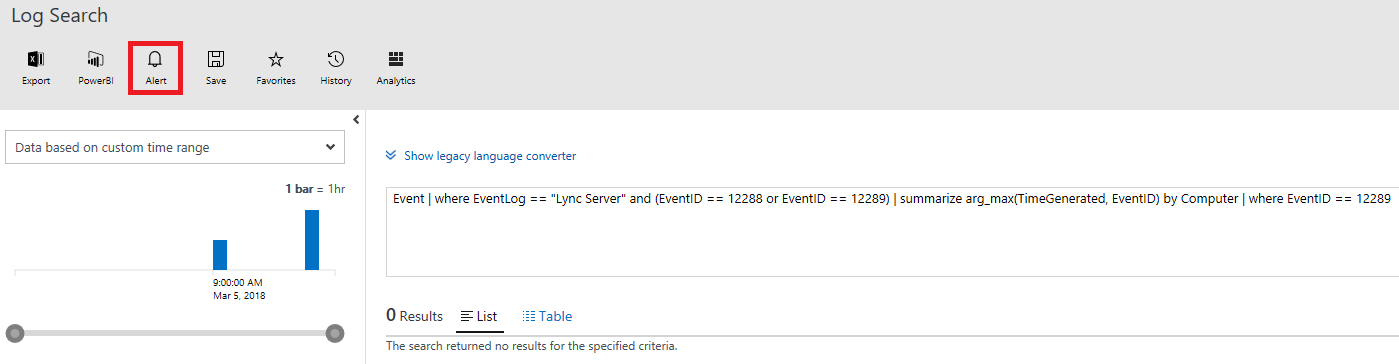
Setting up alerts is super easy. Just run the query you want to have a result on e.g: RTCSRV service has stopped:
Event | where EventLog == "Lync Server" and (EventID == 12288 or EventID == 12289) | summarize arg_max(TimeGenerated, EventID) by Computer | where EventID == 12289
Thankfully I haven’t got any results for this, but I do have an option to create an alert based off the current query:
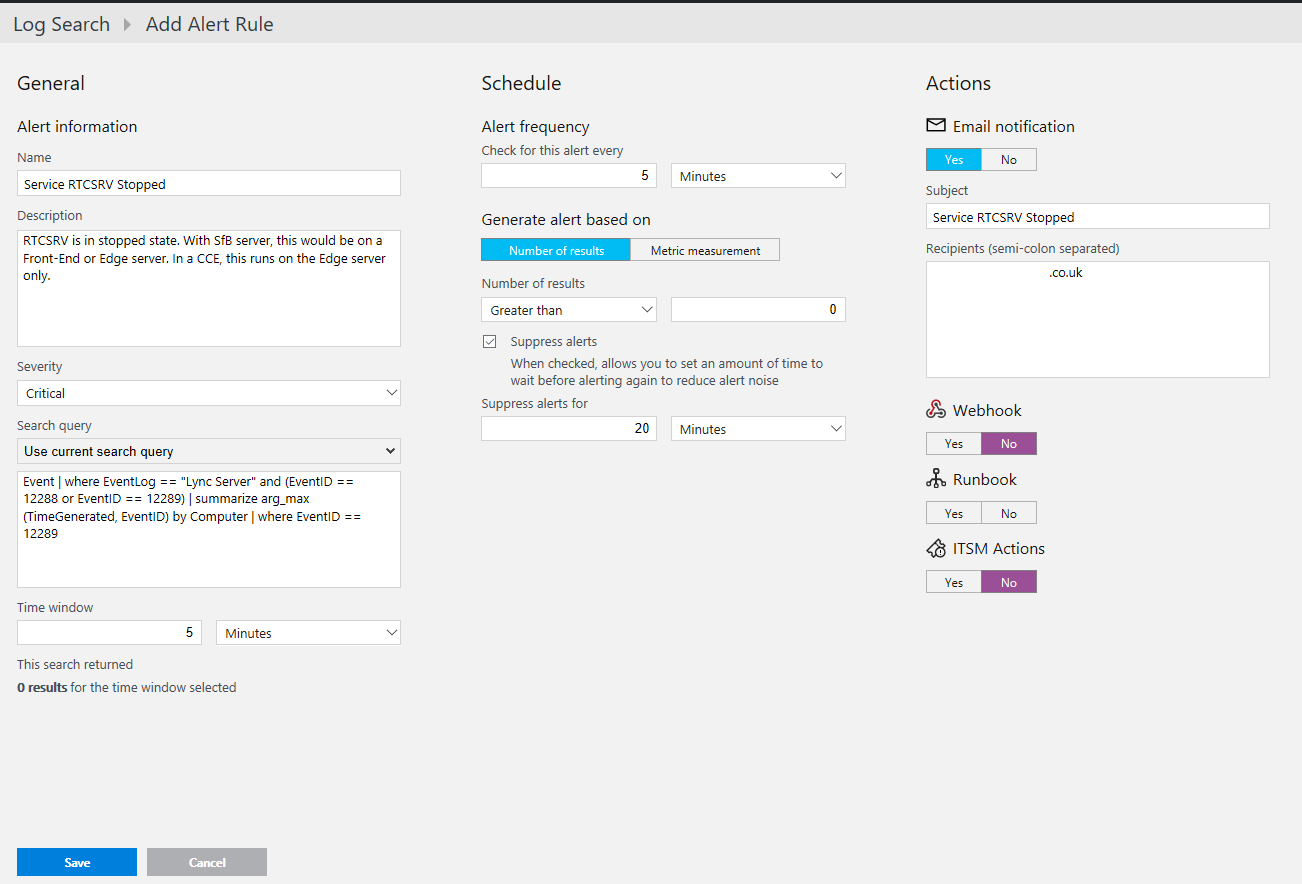
On clicking the alert button you will be prompted to fill in the alert rule. You will need to populate the following:
- Name
- Severity - Critical, Warning or Informational.
- Time Window - How far back to check for results when running the query.
- Alert Frequency - How often to run the query.
- Generate Alert based on - The conditions on whether the alert is fired. You could have the query return a result, but you may want 3 results in the time frame to conclude there is an issue and fire the alert.
- Suppress Alerts - Set an amount of time where the same alert will not be fired.
- Email notification recipients
In my scenario of the RTCSRV service stopping, I want a critical alert and I want it to be sent immediately on the first result. Because of this, I have set the time window and frequency of 5 minutes and only requiring 1 result to fire:
To be notified that the same service has started again, I setup a return to service (reset) alert also.
Event | where EventLog == "Lync Server" and (EventID == 12288 or EventID == 12289) | summarize arg_max(TimeGenerated, EventID) by Computer | where EventID == 12288
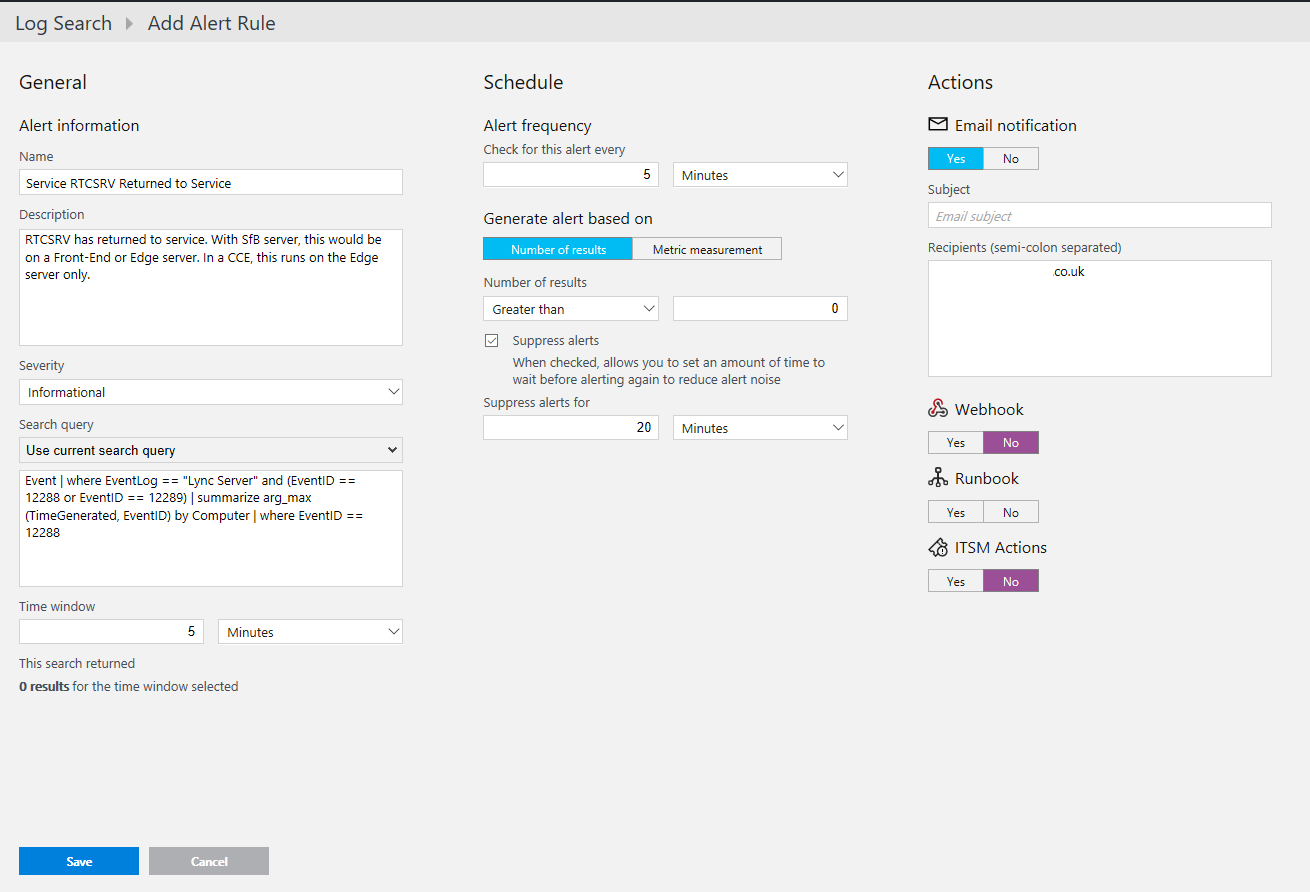
(The only real change on this one is the severity to informational)
One point to mention here is, receiving a reset alert will not clear the critical alert as they are separate alert queries.
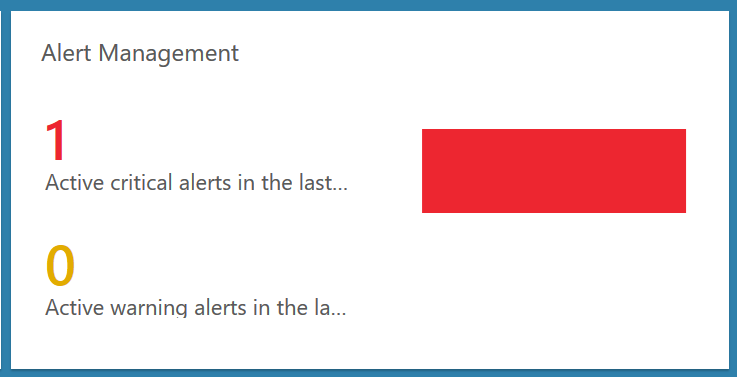
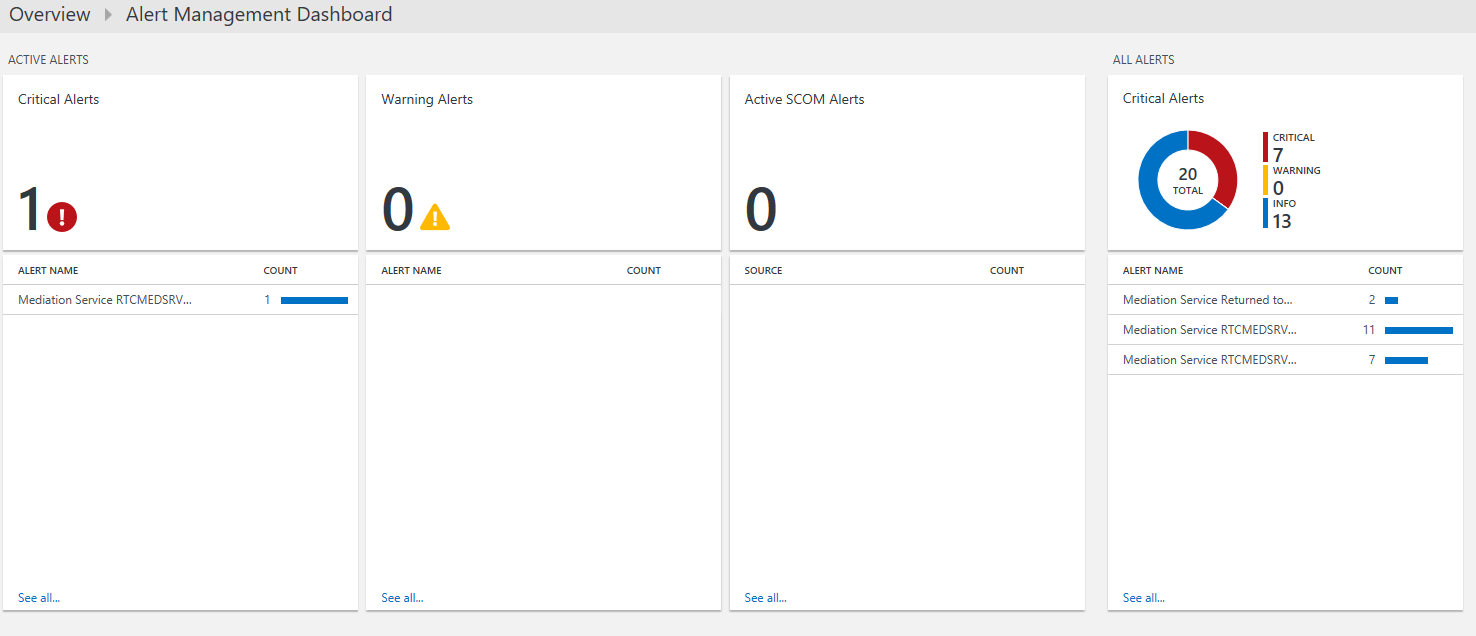
Alerts can be managed from the Alert Management dashboard from the Solutions Gallery. It gives you a nice overview of any alerts.
Alerts in Teams!
You may have noticed when setting up the alerts, there is Webhook support, which MS Teams supports, so would be rude not to!
-
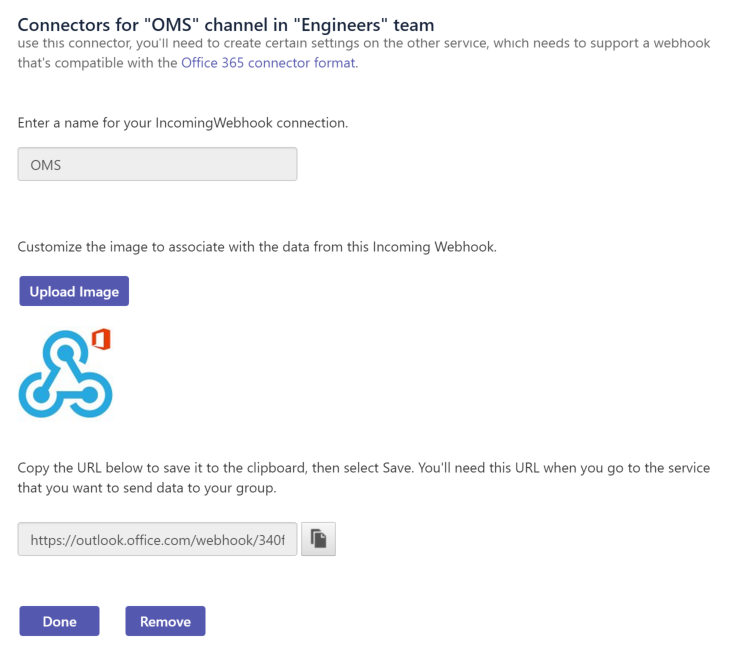
Add the Incoming Webhook connector to your channel, copy the URL.
-
Open an alert and set Webhook to Yes, paste the URL and enter some JSON payload (you can modify the JSON payload as per the OMS Documentation):
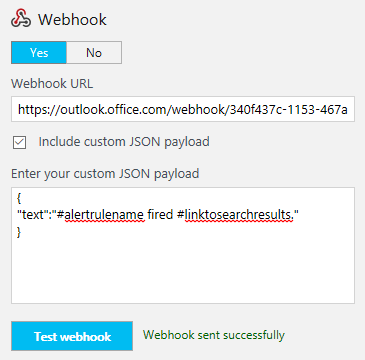
(Then click test and make sure it fires). -
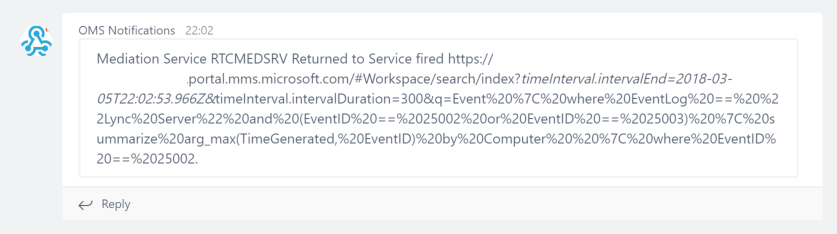
If you look in Teams you should have a notification in the channel:
Dashboards
The final piece I’d like to show for OMS is dashboards. Dashboards can be setup using the same queries we’ve already used, but present the data in a more readable format. There are some built in dashboards (such as the Alert Management mentioned above) from the Solutions Gallery. I’m not going to go over these, but instead show how you can create your own:
-
Click the + icon on the left hand menu.
-
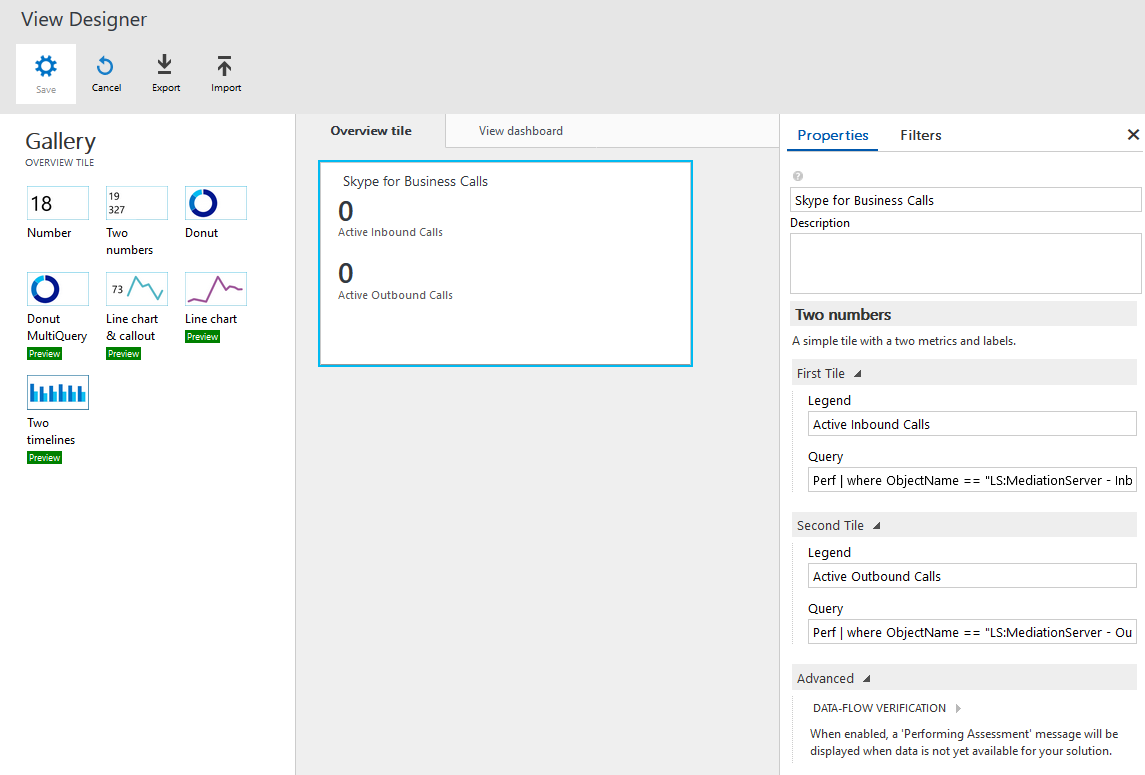
You are now in the View Designer. First thing we need to create is the overview tile. This is a quick glance of the dashboard. In this example I am going to list current incoming and outgoing calls from the performance counters. I select a two numbers tile, give it a name and populate both parts of the tile with a query:
Active Inbound Calls:
Perf | where ObjectName == "LS:MediationServer - Inbound Calls" | summarize arg_max(TimeGenerated, CounterValue) by ObjectName, Computer | summarize TotalCalls = sum(CounterValue)Active Outbound Calls:
Perf | where ObjectName == "LS:MediationServer - Outbound Calls" | summarize arg_max(TimeGenerated, CounterValue) by ObjectName, Computer | summarize TotalCalls = sum(CounterValue)
-
Once complete make sure you click Apply.
-
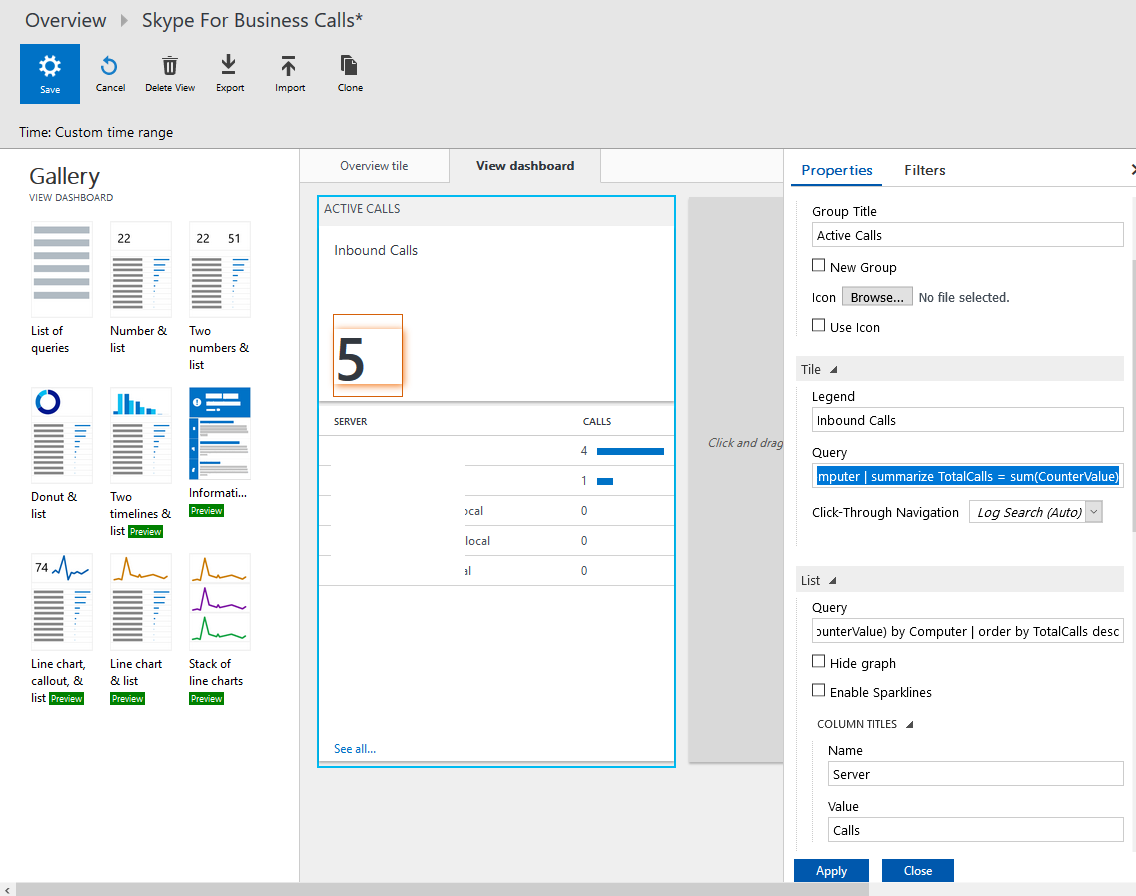
Now select View dashboard. This is where we can populate more information. In my example of active calls on the overview tile, I will create a line chart, give it a name and will list inbound calls. This will give a combined total across all mediation servers, but will also list each mediation server’s total. Here are the queries:
Total Tile:
Perf | where ObjectName == "LS:MediationServer - Inbound Calls" | summarize arg_max(TimeGenerated, CounterValue) by ObjectName, Computer | summarize TotalCalls = sum(CounterValue)Per Mediation Server List:
Perf | where ObjectName == "LS:MediationServer - Inbound Calls" | summarize arg_max(TimeGenerated, CounterValue) by ObjectName, Computer | summarize TotalCalls = sum(CounterValue) by Computer | order by TotalCalls desc
 3. Make sure you click Apply again and once finished click Save to save the dashboard.
I have followed the above and created a few more dashboards to show what can be done:
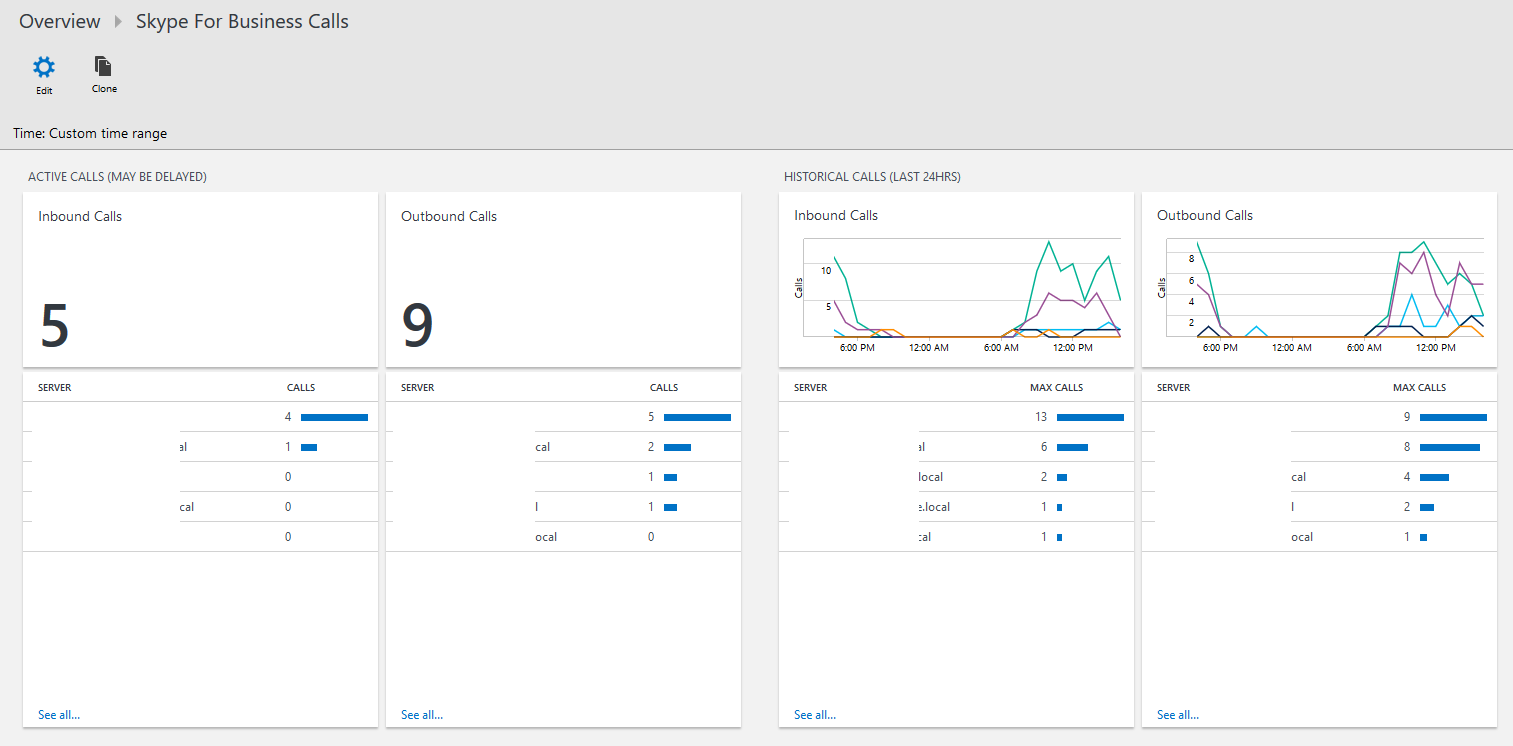
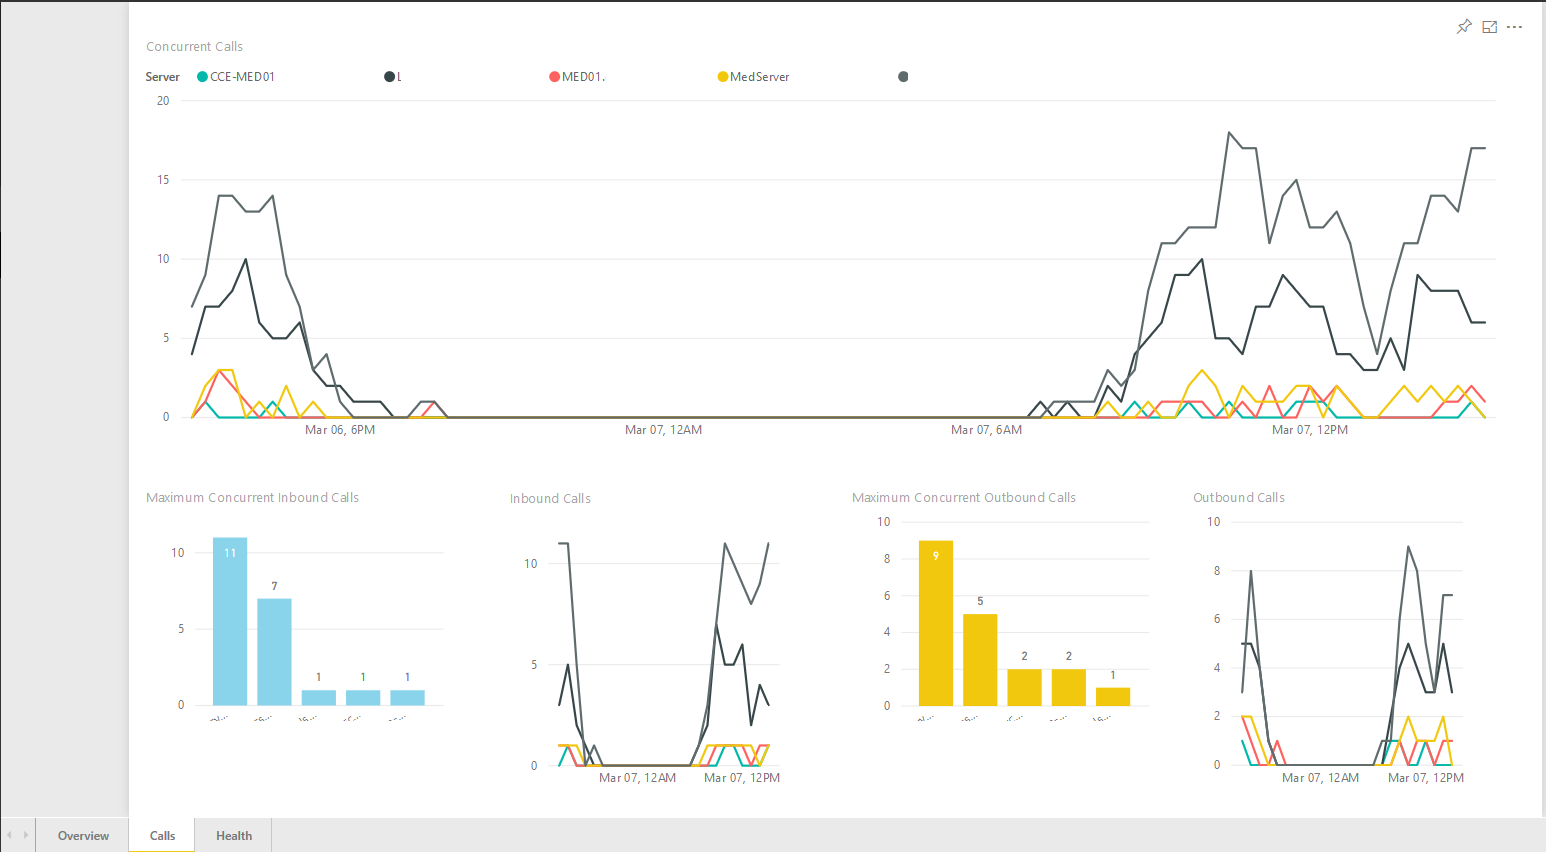
Calls:
This lists active inbound and outbound calls with a breakdown for each mediation server. Note: we don’t always receive the performance counters into OMS immediately, so the figures may be delayed by a few minutes. In addition, we have created historical call stats for the last 24 hours, showing peak usage per mediation server.
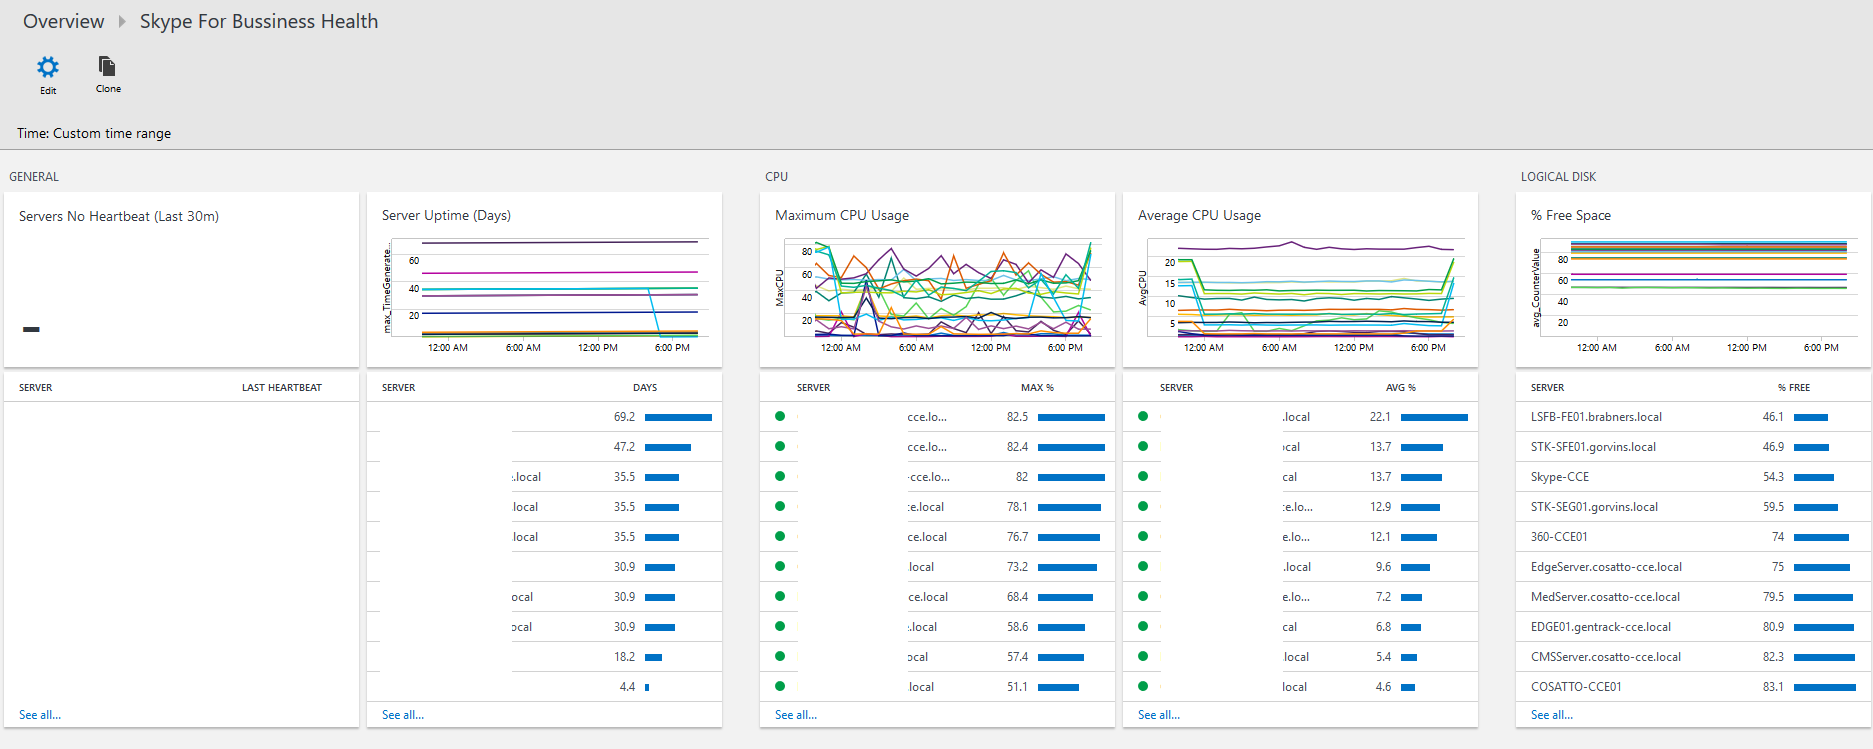
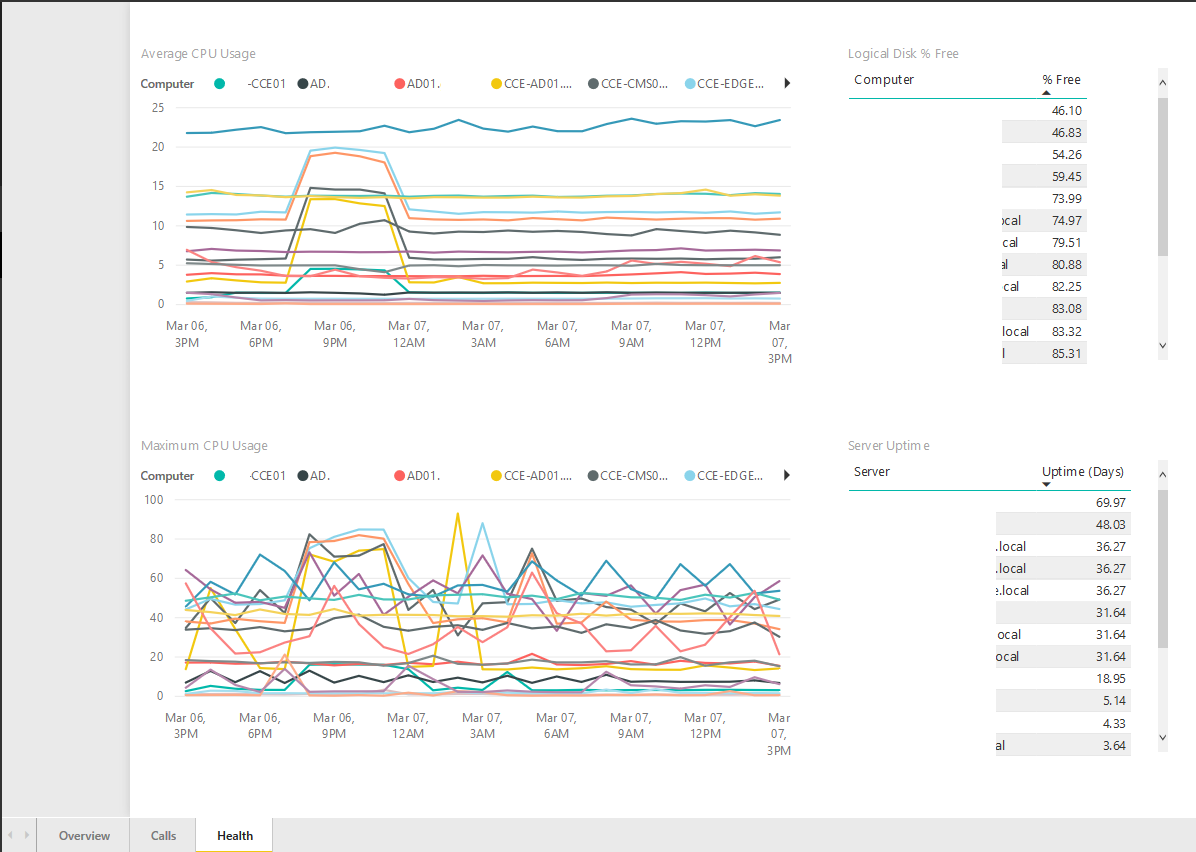
Health:
This is not really CCE or SfB server specific, but I think its worthwhile having it anyway. It monitors any servers that may have not called home in the last 30 minutes, server uptime, CPU usage and hard-disk usage. Note: The uptime counter in Windows can act a little strange if using fast startup, as the counter doesn’t reset under automatic reboots. A manual reboot resets this.
Because I’m nice, I’ve attached both dashboards, so you can import directly in to OMS and save yourself some time.
PowerBI
On to the final part. Whilst the OMS dashboard is great at giving you and overview, what if you already have existing Power BI dashboards or reports? What if you want to display the data in a particular way you cannot in OMS? That’s where Power BI comes in! Any data that is OMS can be queried from Power BI.
The workflow for getting something from OMS to Power BI is as follows:
-
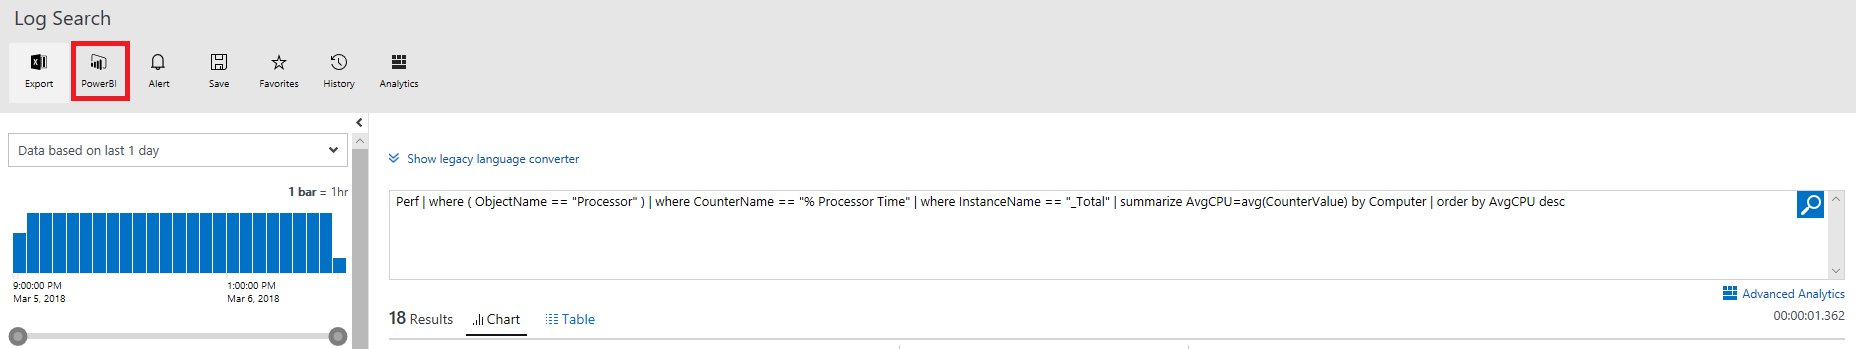
Run desired query in OMS Log Search.
-
Once the query has completed, click the Power BI button.
-
Open the download in notepad and copy it to the clipboard.
-
Open Power BI Desktop (not the web version). Create new file.
-
Select Get Data -> Blank Query from the Home ribbon.
-
In the Query Editor select Advanced Editor on the Home ribbon. Paste the contents of the Power BI query and click Done.
-
You may get prompted to enter your organisation credentials to access the Azure resource when running the query.
-
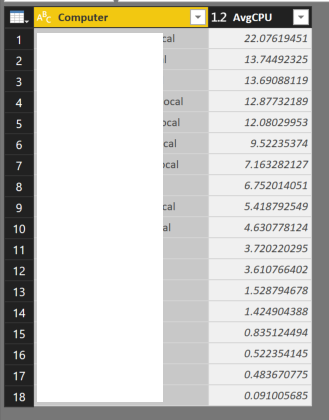
It should return the same result set as the query you ran in Log Search.
-
You can now close the Advanced Editor.
-
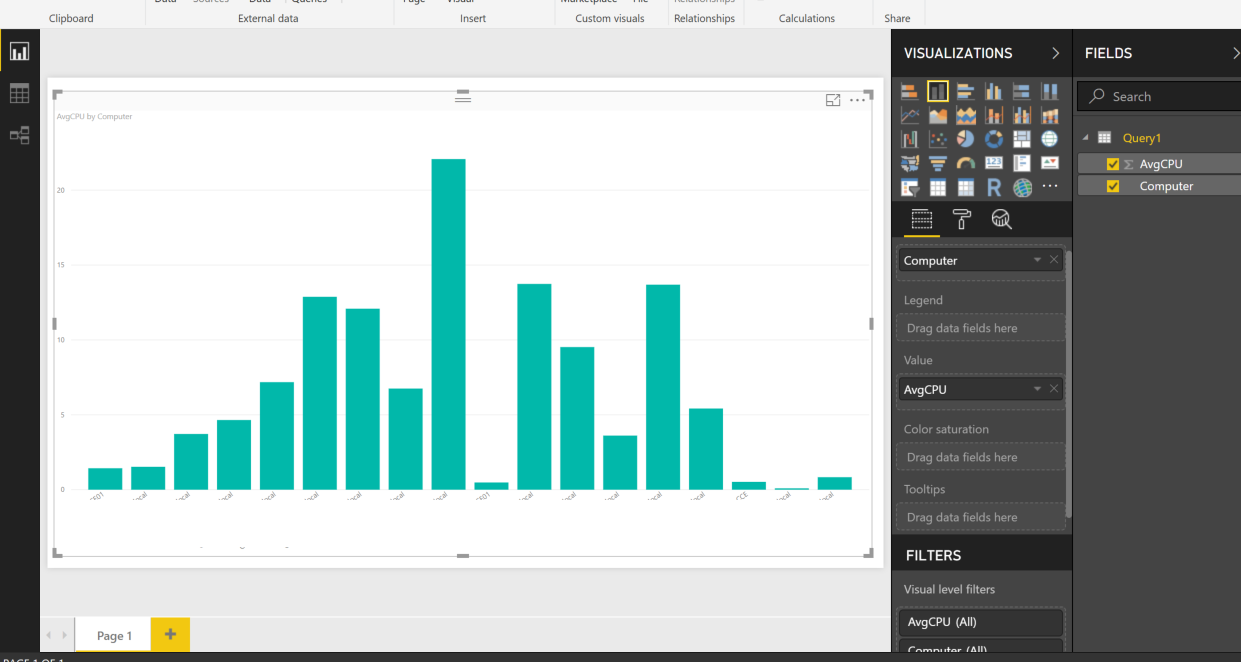
You can now use that data to create a graph etc.
-
Now we want to send this to Power BI web. All you need to do is click Publish on the Home ribbon. You may need to select a destination Workspace and be asked to sign in your organisation account.
-
Now it’s in Power BI web.
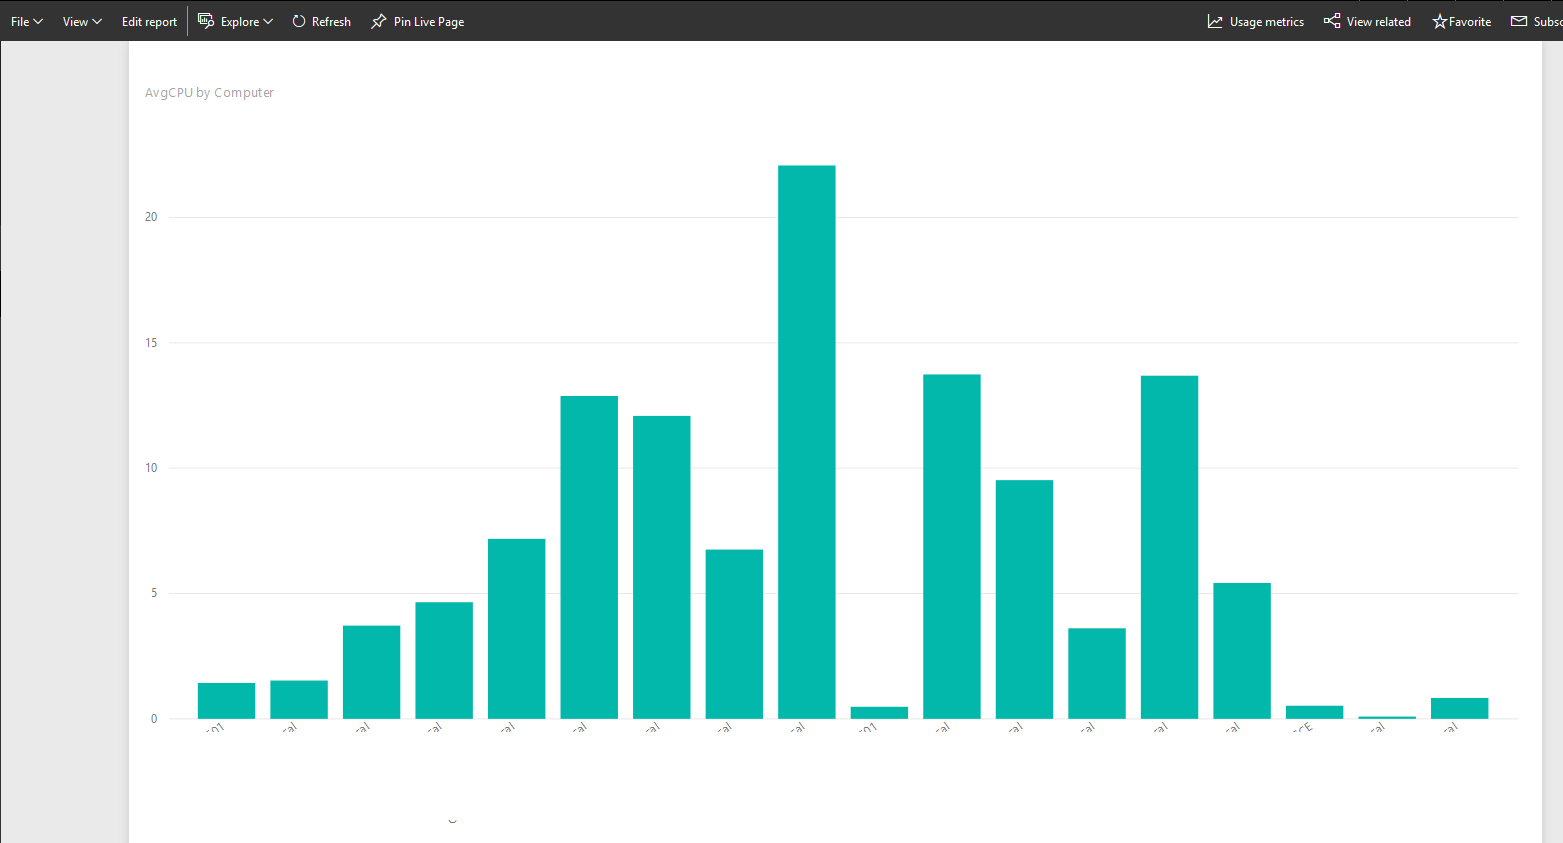
Using the Power BI queries generated by Log Search and can take bit of tinkering get it how you want. I’ve spent a bit of time and managed to create similar dashboards in Power BI to demonstrate:
Overview:
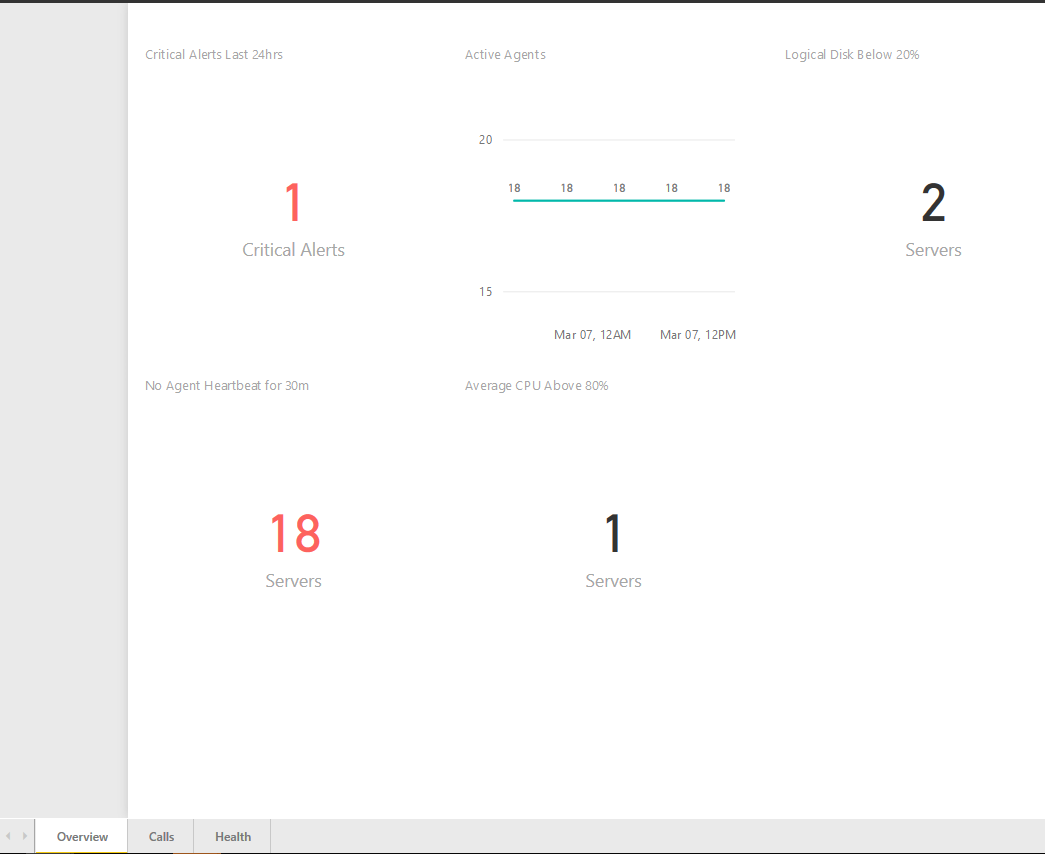
Calls:
Health:
Wrap up
Quite a lengthy post in the end. I hope this helps someone setup monitoring of CCE or SfB server. I think at the bare minimum the alerts are a great help. Having a dashboard as a visual aid also helps you keep better handle of the day-to-day working e.g. are we getting close to the maximum PSTN calls dictated by the CCE, SBC or SIP provider?
I’ve also noted down some queries I commonly used into a spreadsheet, which might help someone.