Monitoring Skype Room System v2 with Azure OMS and Power BI
Introduction
Following on from my blog post about monitoring SfB and CCE in Azure OMS and Power BI, then recently deploying a Skype Room System (SRS) for the first time, I came across monitoring SRS devices via Azure OMS.
This seems a good idea, much like it did for CCEs, as these are unmanaged devices spread across the network where you might not always have someone on hand to keep an eye on them. As they are effectively Windows machines, this is a pretty straightforward process.
Enter Azure OMS
I’ve talked about OMS before, but it is essentially an Azure service which can monitor Windows and Linux agents from Azure. These agents can be physical or virtual, on-premises or in Azure or a mixture. The best part is, it is free to start out. A lot of the set up below will be the same as my previous article which goes into more detail.
Creating an Azure OMS Workspace
The first bit we need to do is create an OMS Workspace to store all our data (logs).
-
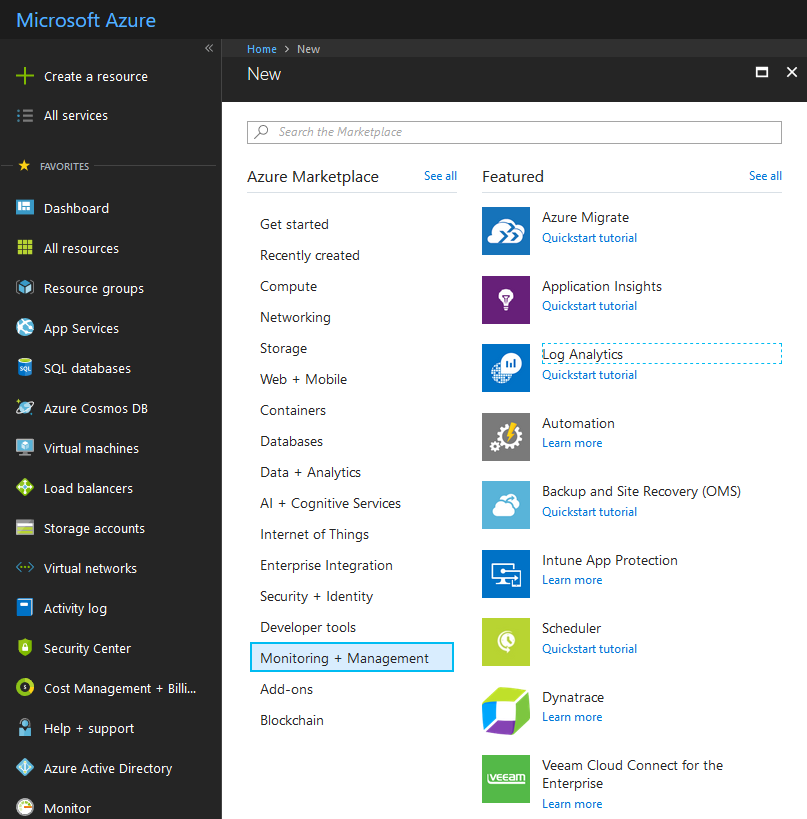
Sign in to the Azure portal (create an account if you don’t have one) and go to Create a resource-> Monitoring and Management -> Log Analytics.
-
If you don’t have an OMS Workspace already created, create one. Select the relevant subscription and resource group to use:
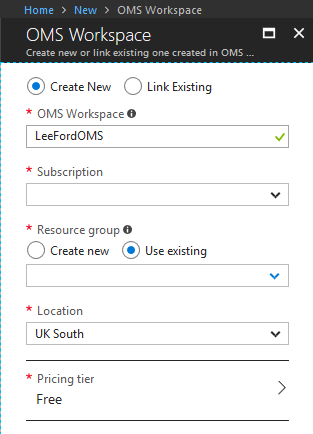
Edit 04/07/18 - (The Free Tier is no longer available, instead select the Standard Tier which includes the first 5GB per month free (£2.15 per GB after) and as long as you keep the retention at 30 days, no retention fees).
-
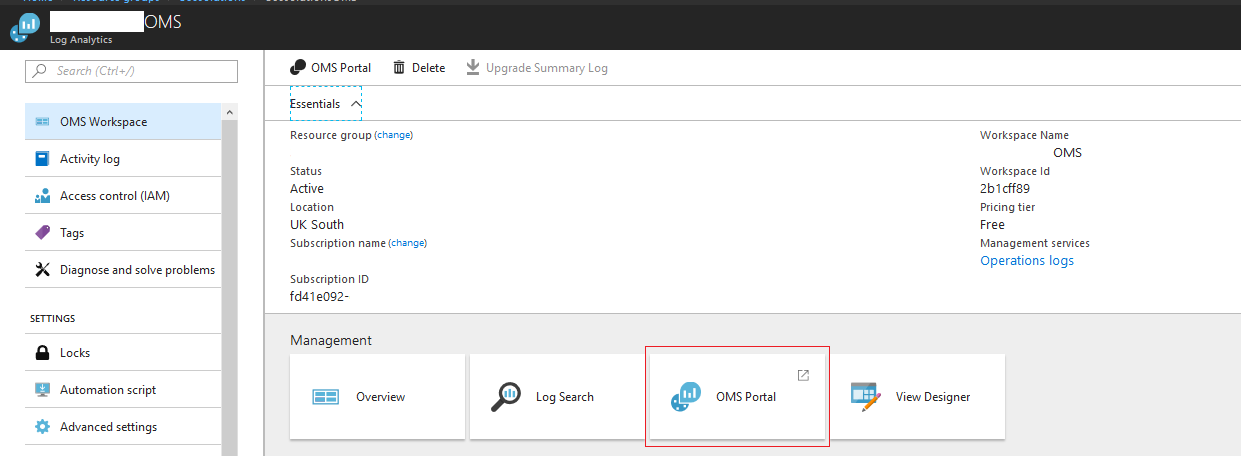
Once the OMS Workspace has been created, find it under the resource group. Then select OMS Portal.
-
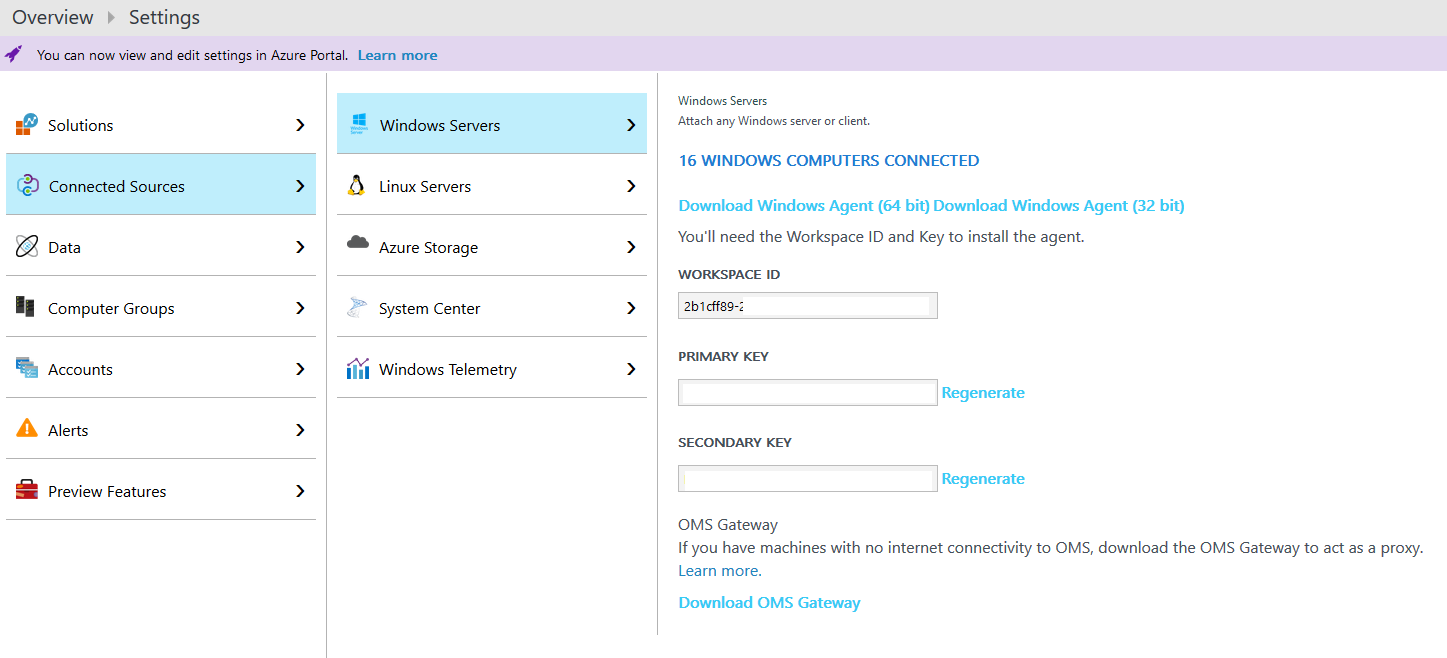
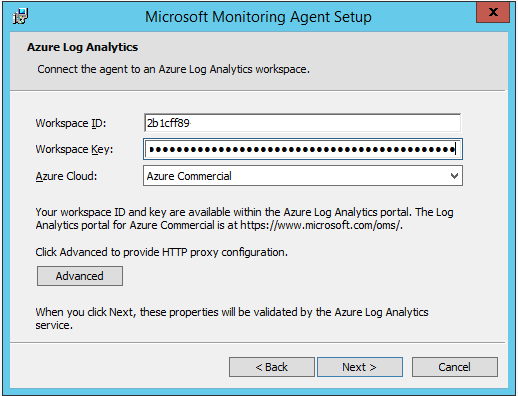
Now we’re in the OMS Portal we need to click the Settings cog at the top and navigate to Connected Sources ->Windows Servers. Keep this page open as we will need the “Workspace ID” and “Primary Key” next.
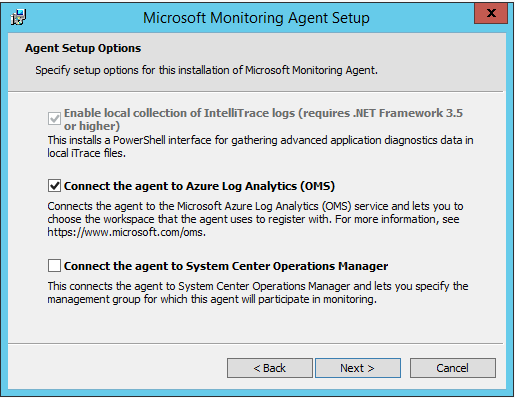
Install the OMS Agent
From the SRS, we need to install the OMS Agent. Whilst you could do this from the “Admin” account at the dock (default password is “sfb”), I would recommend enabling remote desktop under the “Admin” account on SRS and doing it that way.
Once you are on the desktop, do the following on each SRS:
-
From the Settings -> Connected Sources -> Windows Servers page you will see an Agent download link. Download the 64bit Agent.
-
Run the Agent on the SRS.
-
When prompted, select connect the agent to OMS:
-
Then enter the “Workspace ID” and “Primary Key” and select Azure Commercial. If your server connects via an HTTPS proxy, add this here too:
-
Complete the installation.
Confirm the Agents are connected
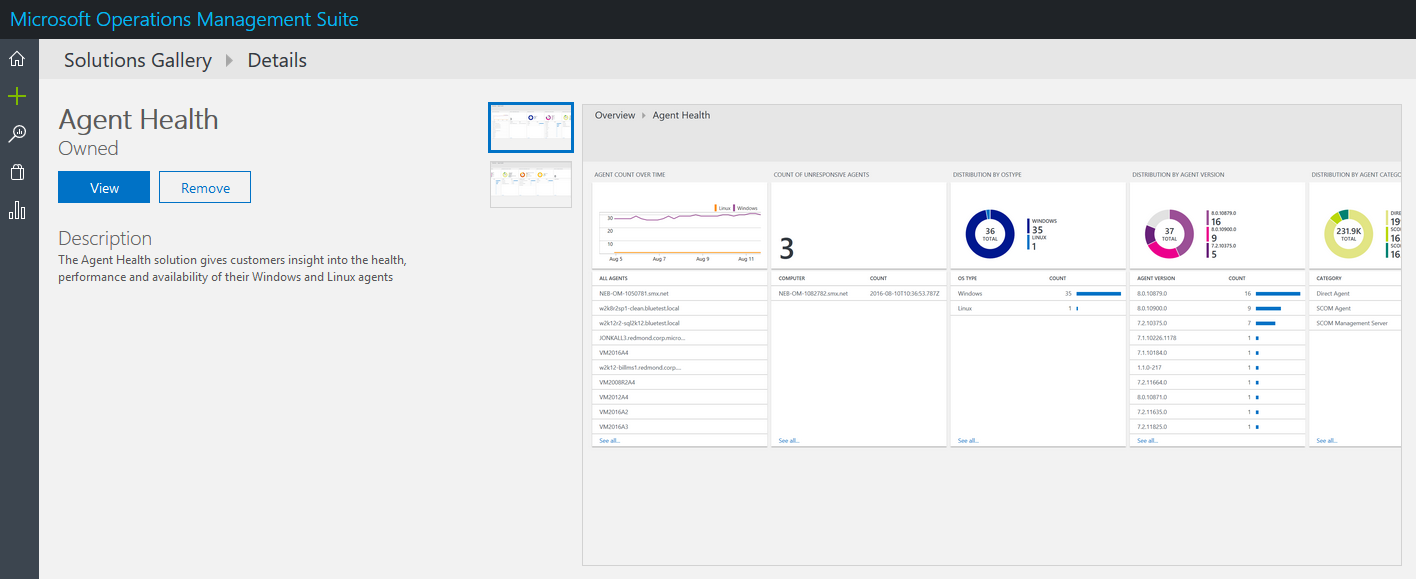
There are multiple ways of doing this, but installing the Agent Health Dashboard is a nice GUI to show the status of all your Agents in one place. You can install this from the Solutions Gallery (shopping bag on the left-hand menu).
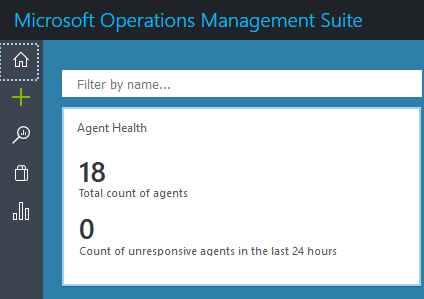
Once installed, it can be accessed from the Home Page. In this example I have 18 active Agents:
Specifying what data to send to Azure OMS
We now need to specify some data to collect from SRS. If you navigate to Settings -> Data we can start adding some data.
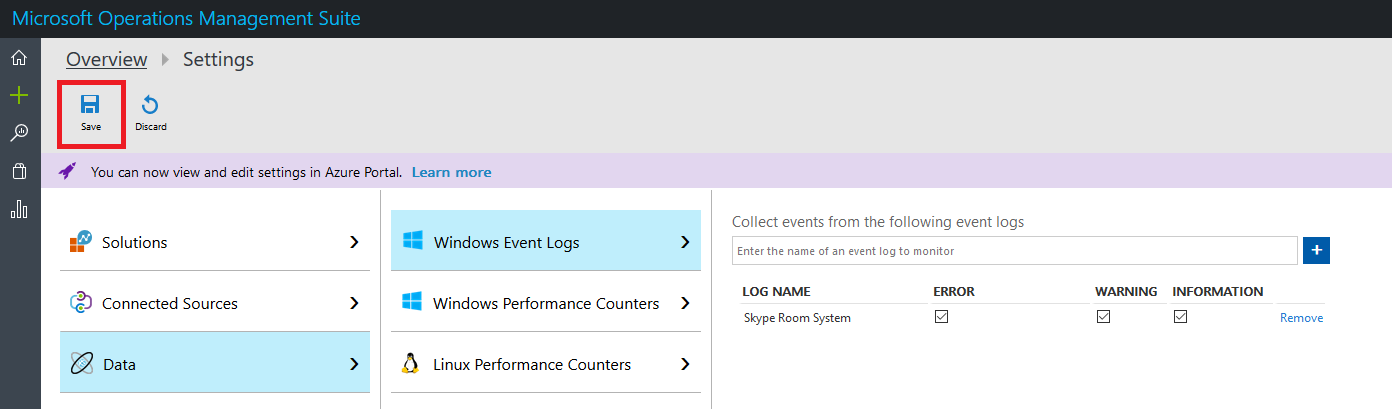
First, one to add is Windows Event Logs. For this article, we only need “Skype Room System” log entries (events).
Note: You will need to type “Skype Room System” it will not auto complete. Make sure you click Save afterwards else it will not save.
Next is Performance Counters. There aren’t any specific counters for SRS, but I wanted to monitor how much free HDD space, CPU usage and uptime of device. Again, don’t forget to save:
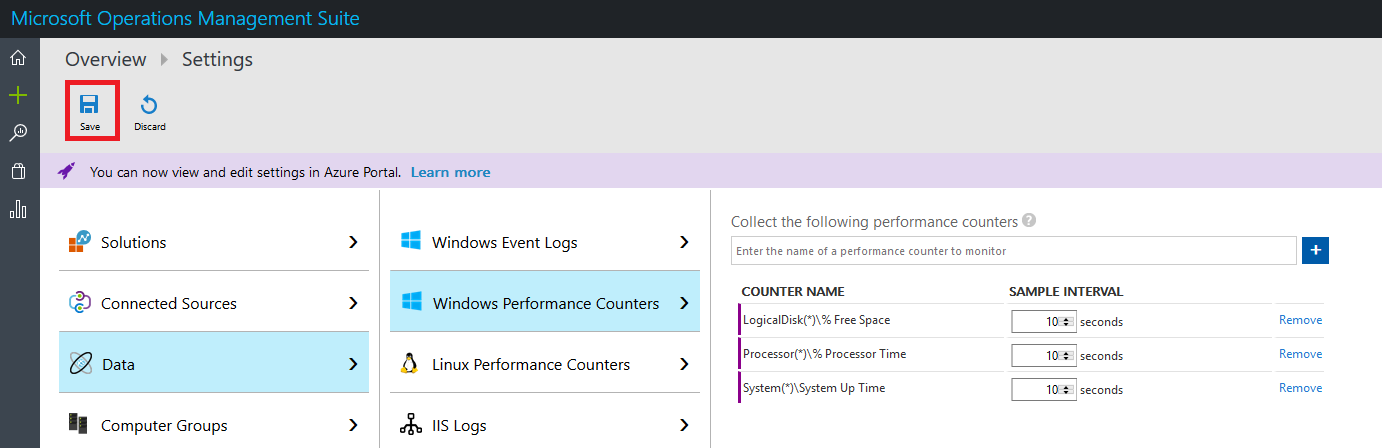
One point worth making is this is the data I’ve chosen to collect for this article, you may want to collect more/less/something else. I’ve also left the sample rate as 10 seconds, but you can adjust how you see fit.
Querying the data (Log Search)
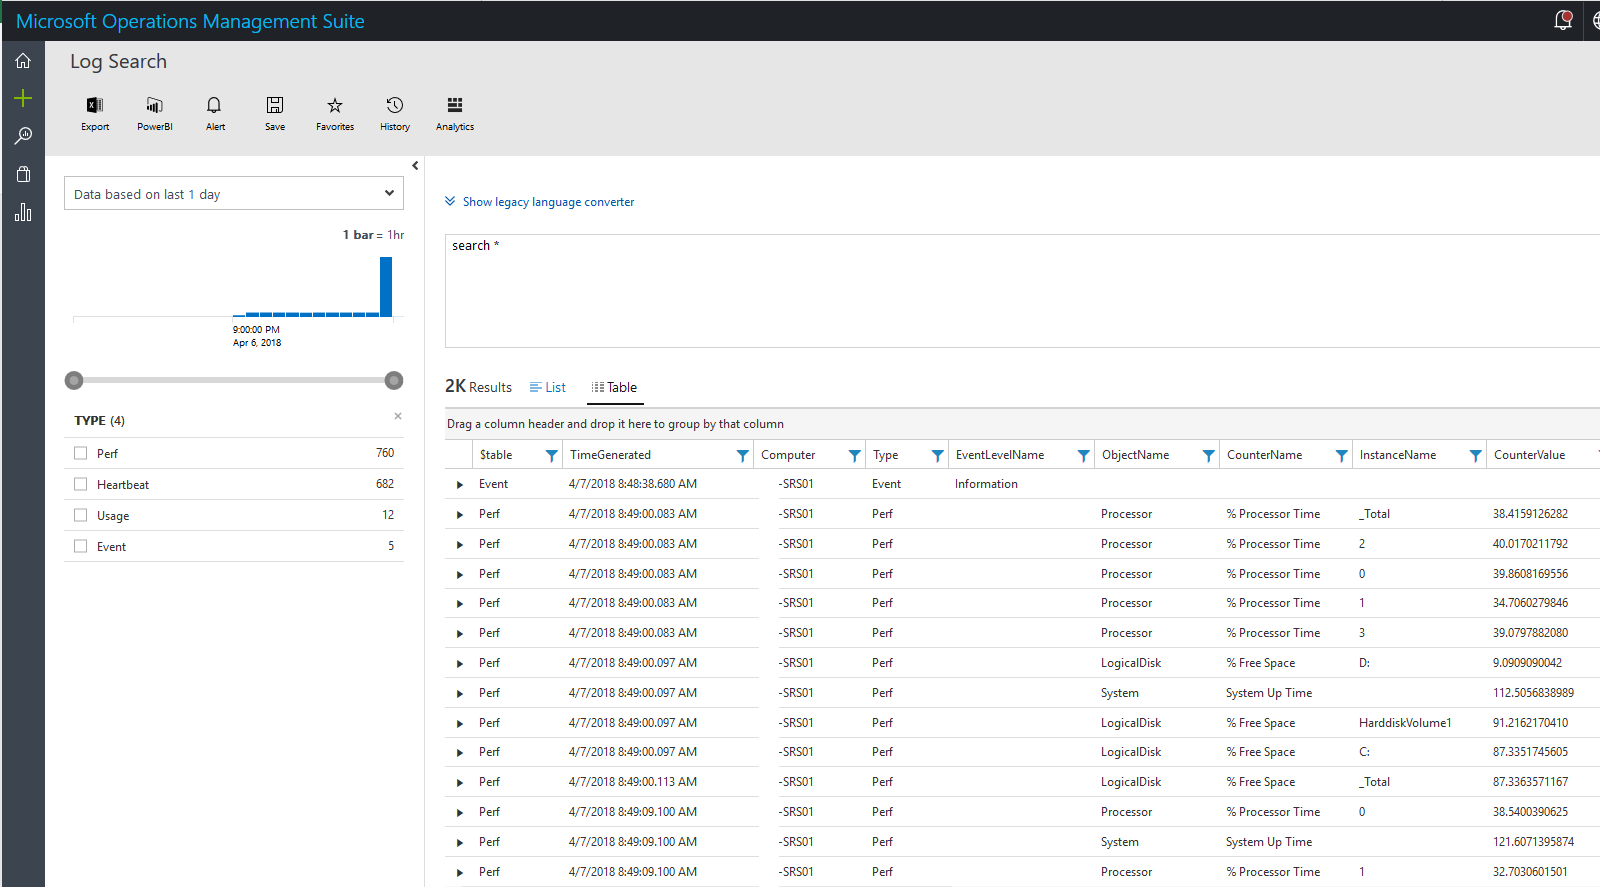
Now we have Agents reporting actual data to OMS, we should start seeing data appear. To access the data and run queries you can use the Log Search tool (magnifying glass on the left-hand menu).
If I just search all data (search *), I can see some event logs and performance logs being received:
If we concentrate on event logs first, SRS sends the following event logs (more details can be found here):
- Software Status: Every 5 minutes either 2000 (OK) or 2001 (Not OK) event is sent. If all is OK, you should only ever see 2000 events.
- Hardware Status: Every 5 minutes a 3000 (OK) or 3001 (Not OK) event is sent. If all is OK, you should only ever see 3000 events.
- Restart: A 4000 is sent when the (SRS) App restarts.
The details in the event logs are in JSON format, which is quite difficult to search for in OMS. Using custom fields we can extract this it to separate fields, which we can then search for. Microsoft recommends some fields are created here.
So let’s look at event logs using this query:
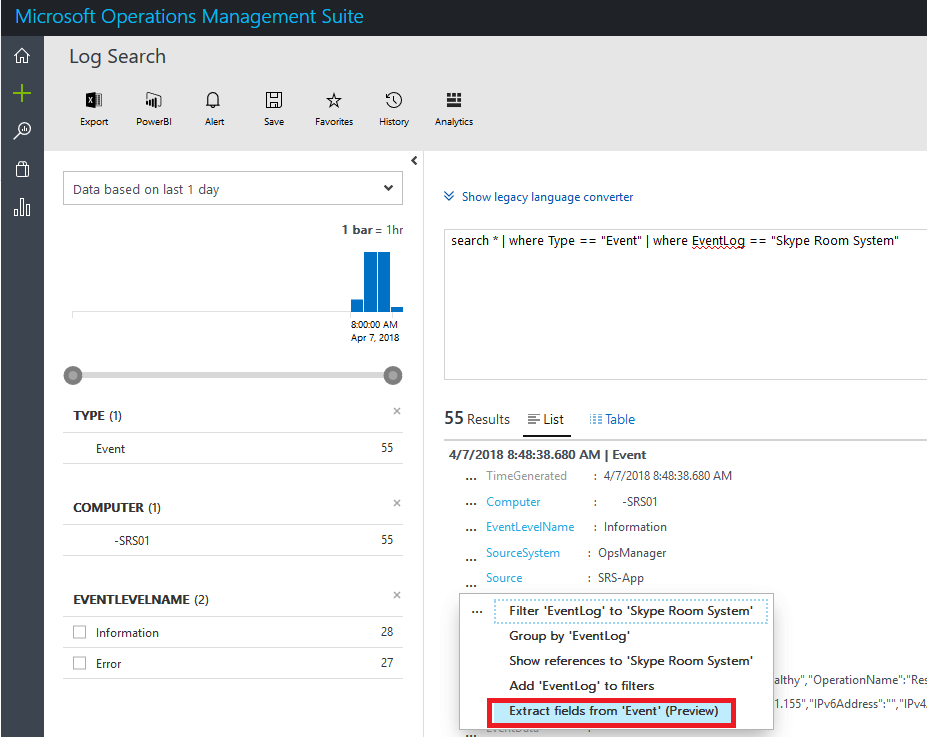
search * | where Type == "Event" | where EventLog == "Skype Room System"
With these results, click the 3 dots next to EventLog and select Extract fields from ‘Event’.
We’re going to create a custom field for the event description, so we do the following:
- Unselect the Event ID (we want to report on all event IDs)
- Highlight the value of RenderedDescription (this one needs to include the quotes or it only captures the first sentence, but other values seem OK without quotes).
- Give the field a name, the _CF is added automatically (I’ve used MS recommended name, but it can be anything)
Click Extract and you should have some results returned. If you now click Save Extraction it will be saved and can be used to query later.
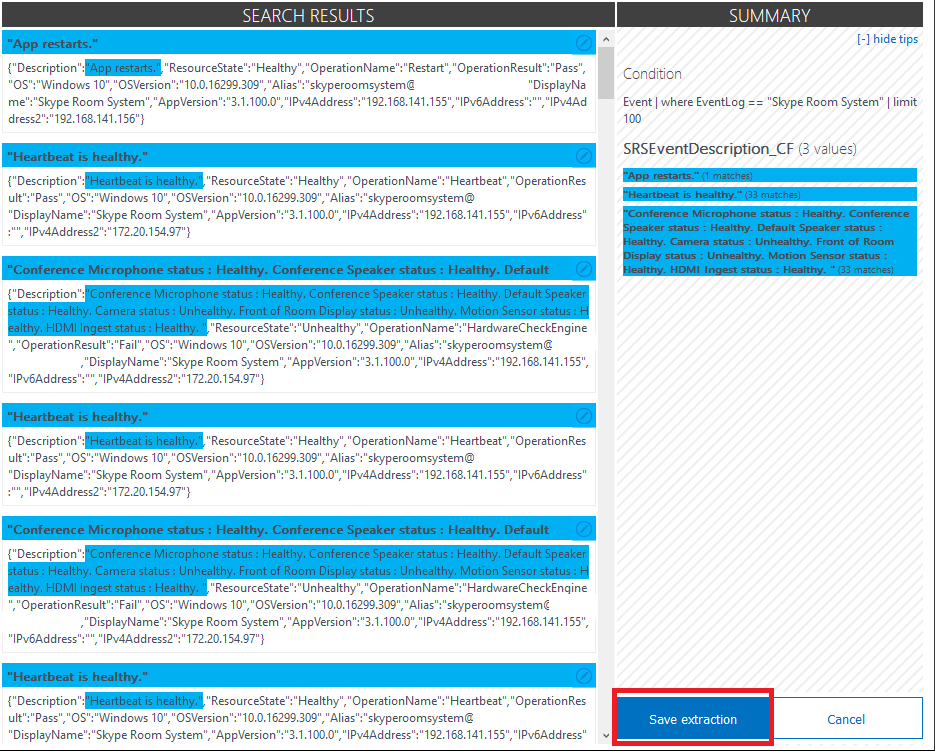
I’ve repeated this step for all Microsoft’s recommended custom fields:
| **JSON field** | **OMS custom field** |
| Description | SRSEventDescription_CF |
| ResourceState | SRSResourceState_CF |
| OperationName | SRSOperationName_CF |
| OperationResult | SRSOperationResult_CF |
| OS | SRSOSVersion_CF |
| OSVersion | SRSOSLongVersion_CF |
| Alias | SRSAlias_CF |
| DisplayName | SRSDisplayName_CF |
| AppVersion | SRSAppVersion_CF |
| IPv4Address | SRSIPv4Address_CF |
| IPv6Address | SRSIPv6Address_CF |
search * | where Type == "Event" | where EventLog == "Skype Room System"
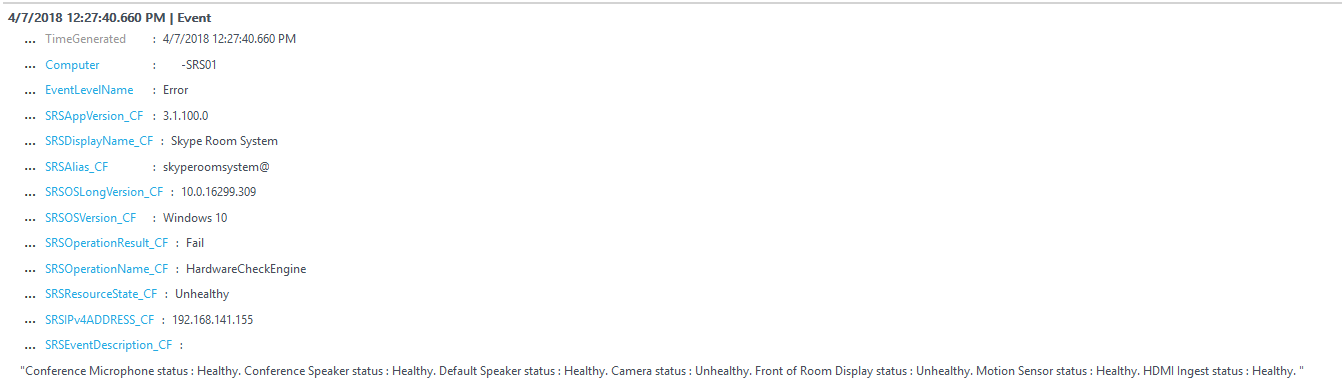
Now I can see the information about the OS, SRS version, IP address etc. much more clearly.
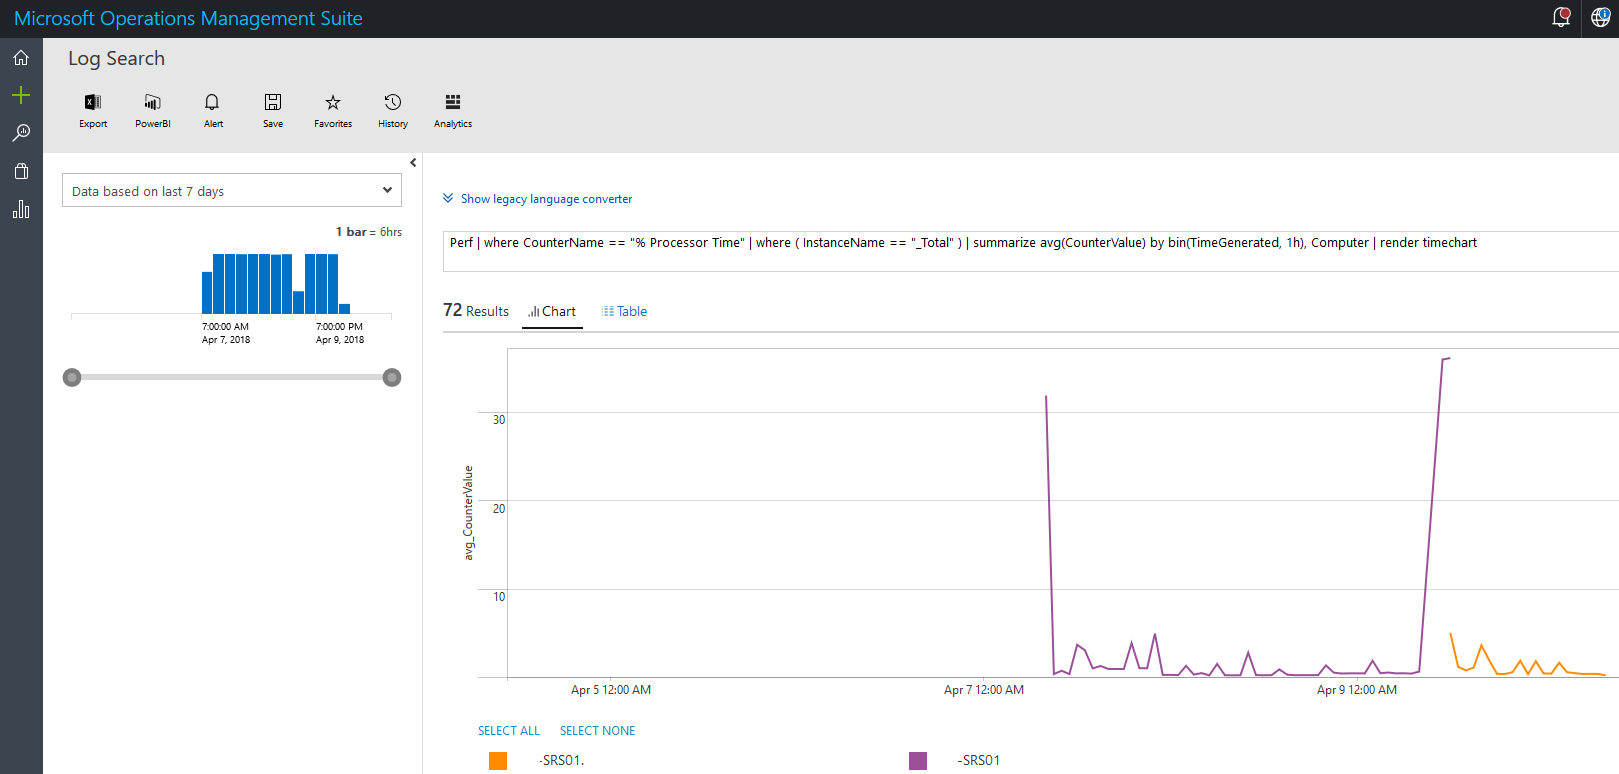
In addition to event logs, we also have performance counters. In my scenario, I’m monitoring CPU and HDD usage. You can query this data in a similar fashion. Let’s run a query on average CPU usage broken down each hour:
Perf | where CounterName == "% Processor Time" | where ( InstanceName == "_Total" ) | summarize avg(CounterValue) by bin(TimeGenerated, 1h), Computer | render timechart
Whilst querying data from log search is great for quickly checking something, we can use these queries in other ways (read on).
Alerts
You can set alerts directly in OMS, but these are being migrated into Azure monitoring shortly, so it makes sense to do them there.
Note: There is an additonal charge for alerts, especially if using SMS/Voice notifications.
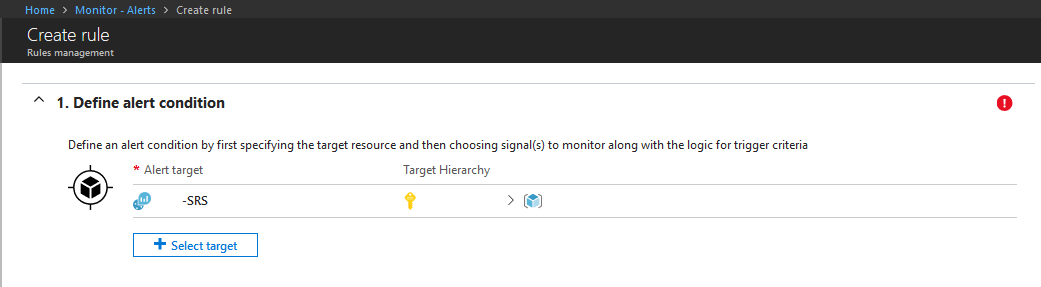
If you go to Monitor -> Alerts -> Create a new rule to add an alert rule.
Here I’ve selected my OMS Workspace as the target:
Next, let’s create a target criteria as a custom log search query - in this case, I want to know if there is a software fault (EventID 2001 is sent):
Event | where EventLog == "Skype Room System" and (EventID == 2001)
I’ve also said I want it to be monitored every 15 minutes, checking the previous 15 minutes and alert if it happens more than once (to avoid blips):
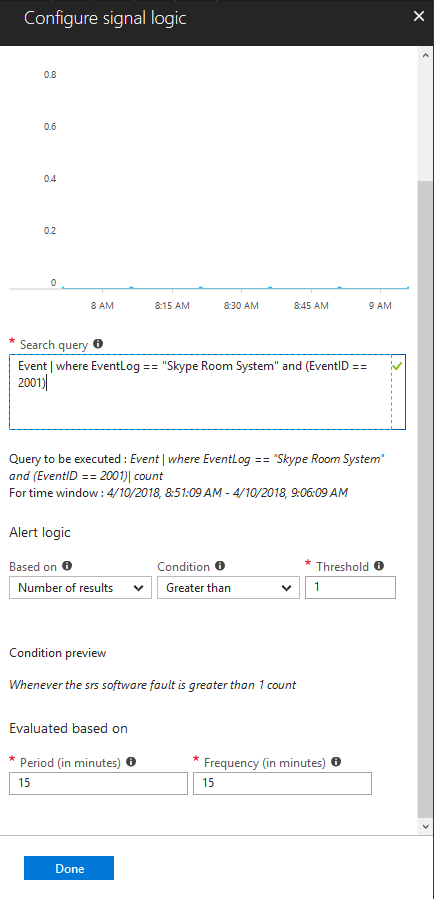
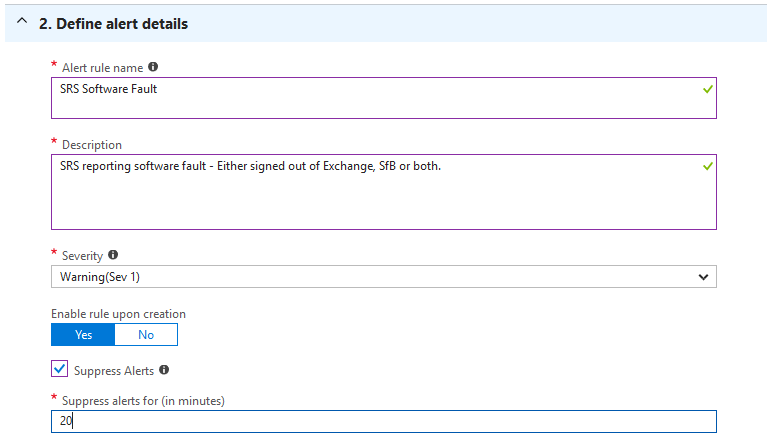
We then give the alert a name, description, severity and if we want to suppress alerts:
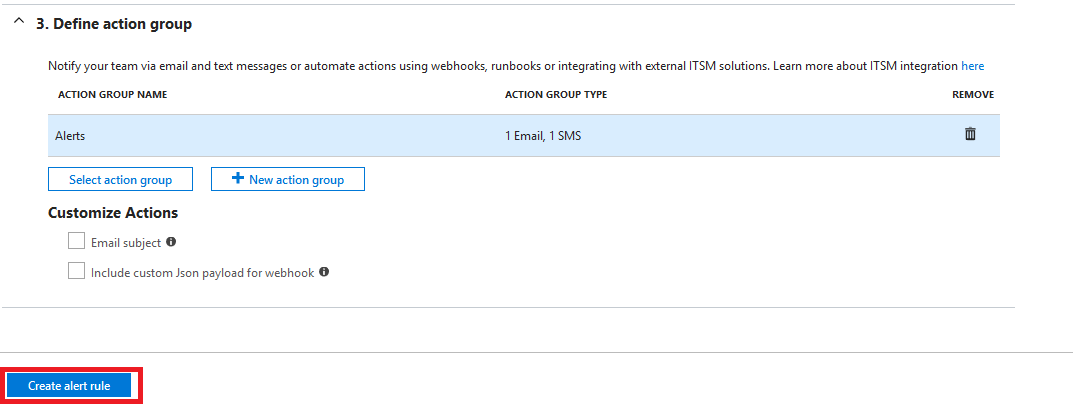
Finally create an action group, where you specify how the alert will notify you and save the alert:
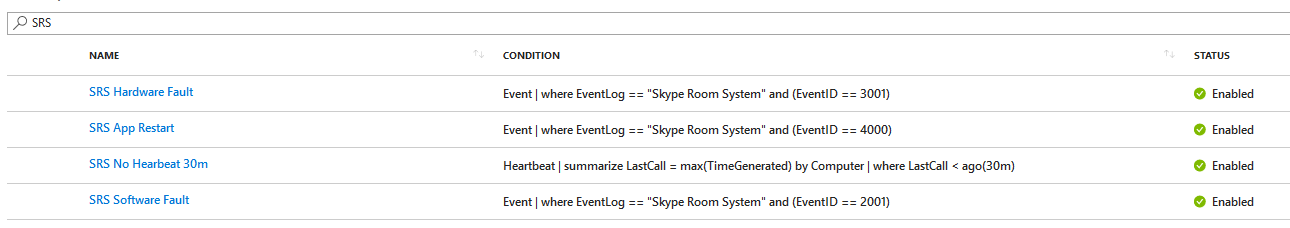
In addition to this alert, I’ve set up one for hardware faults (EventID 3001):
Event | where EventLog == "Skype Room System" and (EventID == 3001)
App restarts (EventID 4000):
Event | where EventLog == "Skype Room System" and (EventID == 4000)
No heartbeat for 30 minutes (offline):
Heartbeat | summarize LastCall = max(TimeGenerated) by Computer | where LastCall < ago(30m)
C drive less than 10% free:
Perf | where ( ObjectName == "LogicalDisk" ) | where CounterName == "% Free Space" | where CounterValue < 10 | where ( InstanceName == "C:" )
Once done, you should have some alerts like below:
Report in Azure OMS
If you click the + icon on the left-hand side of OMS you can create a dashboard, from there you can create custom dashboards that monitor events and performance counters. Along the lines of the SfB health dashboard I’ve already created, I created one for SRS:
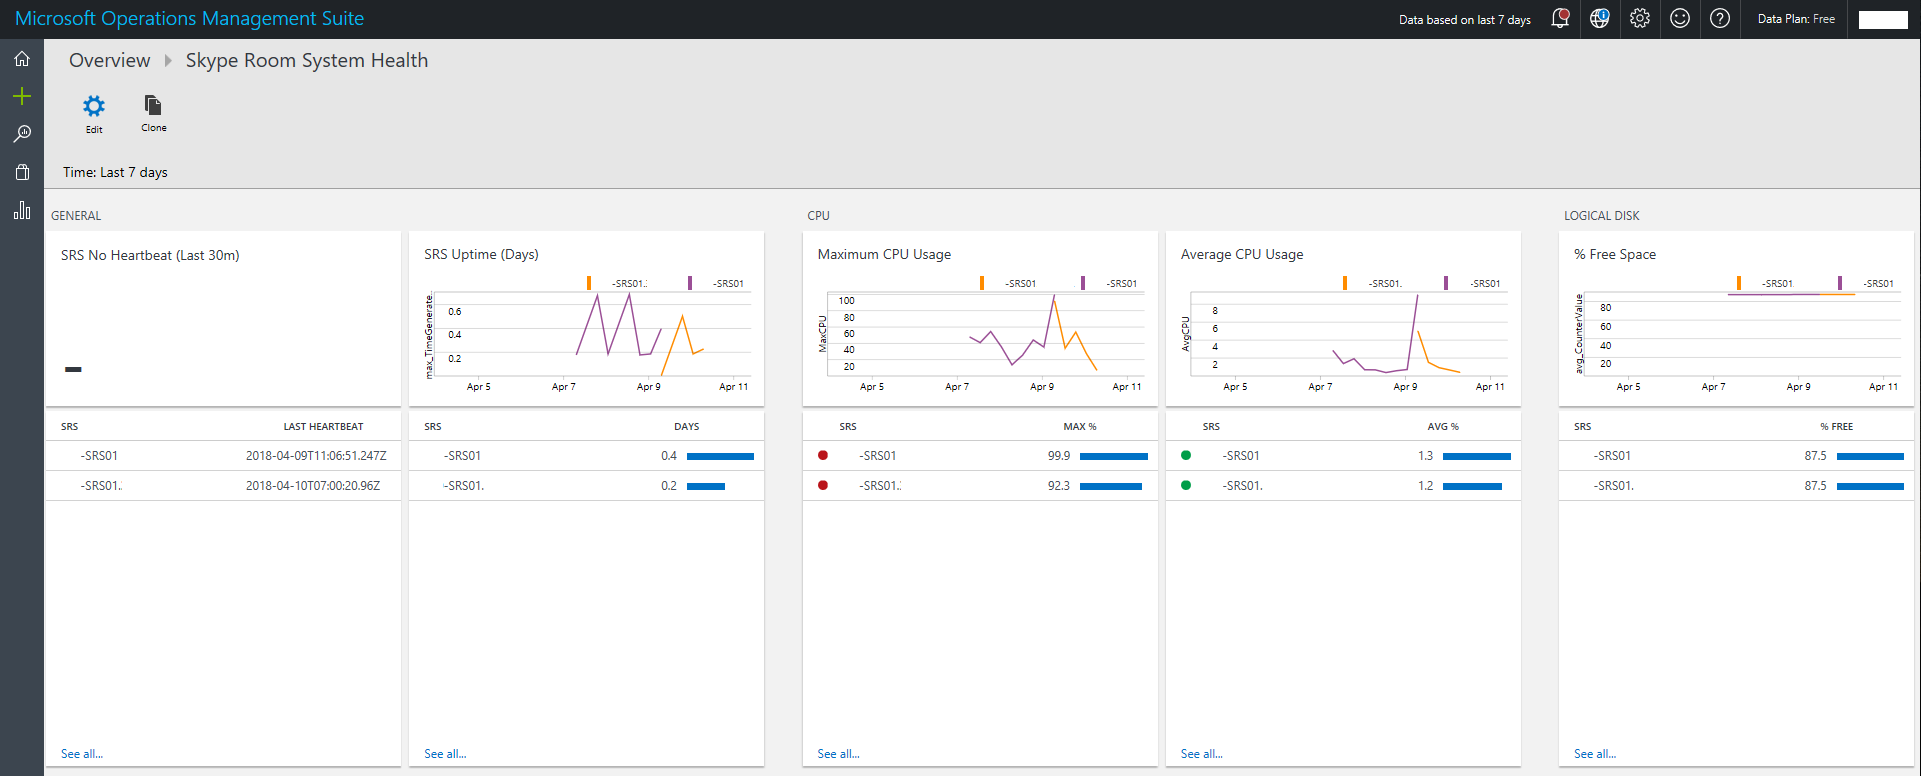
When creating a dashboard you can import dashboards already created. Here’s mine to download and use if you wish:
Unzip the file and import.
Report in Power BI
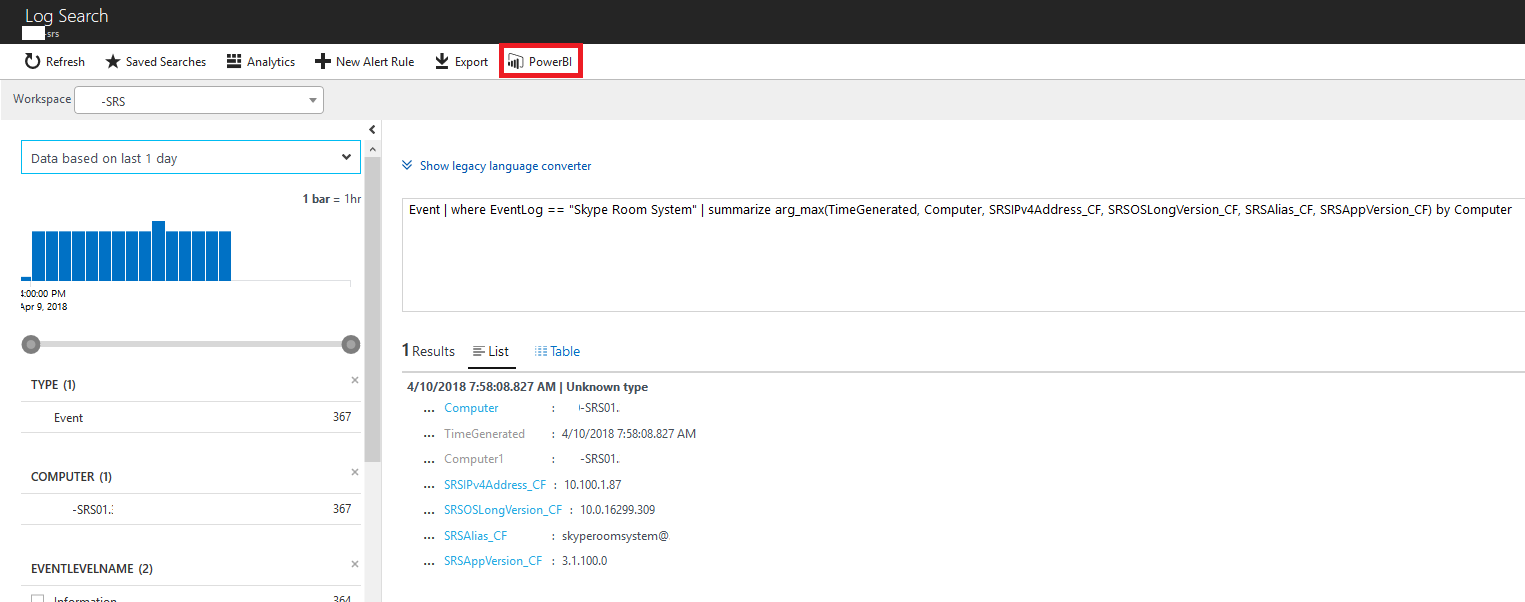
One great part of OMS is the ability to export log search queries as Power BI queries. This allows you to gather the data from OMS directly and display it in Power BI - one benefit over OMS here is the sheer number of ways to display the data and the ability to publish this outside of Azure.
I’ll run through how to gather data from OMS and put into Power BI:
-
Run the desired query in OMS Log Search. In my scenario I’m querying any “Skype Room System” event and requesting the custom fields we set earlier:
Event | where EventLog == "Skype Room System" | summarize arg_max(TimeGenerated, Computer, SRSIPv4Address_CF, SRSOSLongVersion_CF, SRSAlias_CF, SRSAppVersion_CF) by ComputerOnce the query has completed, click the Power BI button.
-
Open the download in notepad and copy it to the clipboard.
-
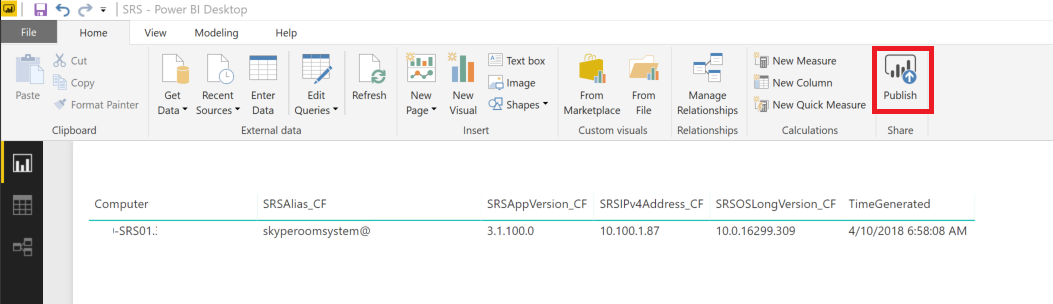
Open Power BI Desktop (not the web version). Create a new file.
-
Select Get Data -> Blank Query from the Home ribbon.
-
In the Query Editor select Advanced Editor on the Home ribbon. Paste the contents of the Power BI query and click Done.
-
You may get prompted to enter your organisation credentials to access the Azure resource when running the query.
-
It should return the same result set as the query you ran in Log Search.

-
You can now close the Query Editor.
-
You can now use that data to create a table etc.
-
Now we want to send this to Power BI web. All you need to do is click Publish (see above). You may need to select a destination Workspace and be asked to sign in your organisation account.
-
Now it’s in Power BI web.
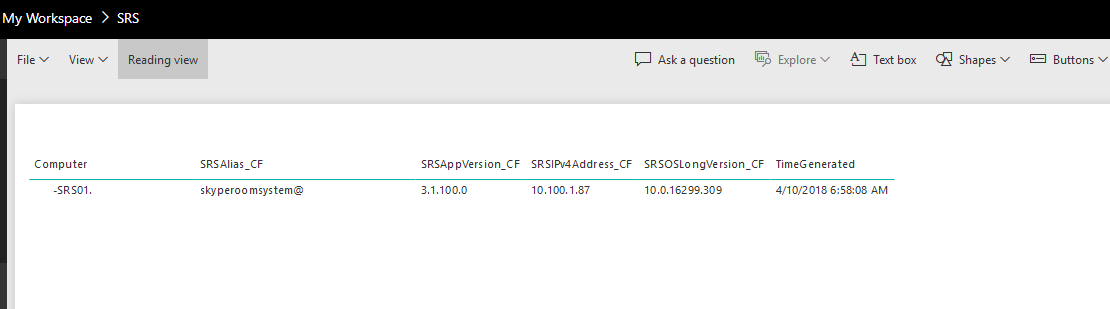
A table full of data isn’t the most exciting visualisation, but it’s just a quick demonstration of how to get data into Power BI. I’ve spent a bit more time and have done the following:
-
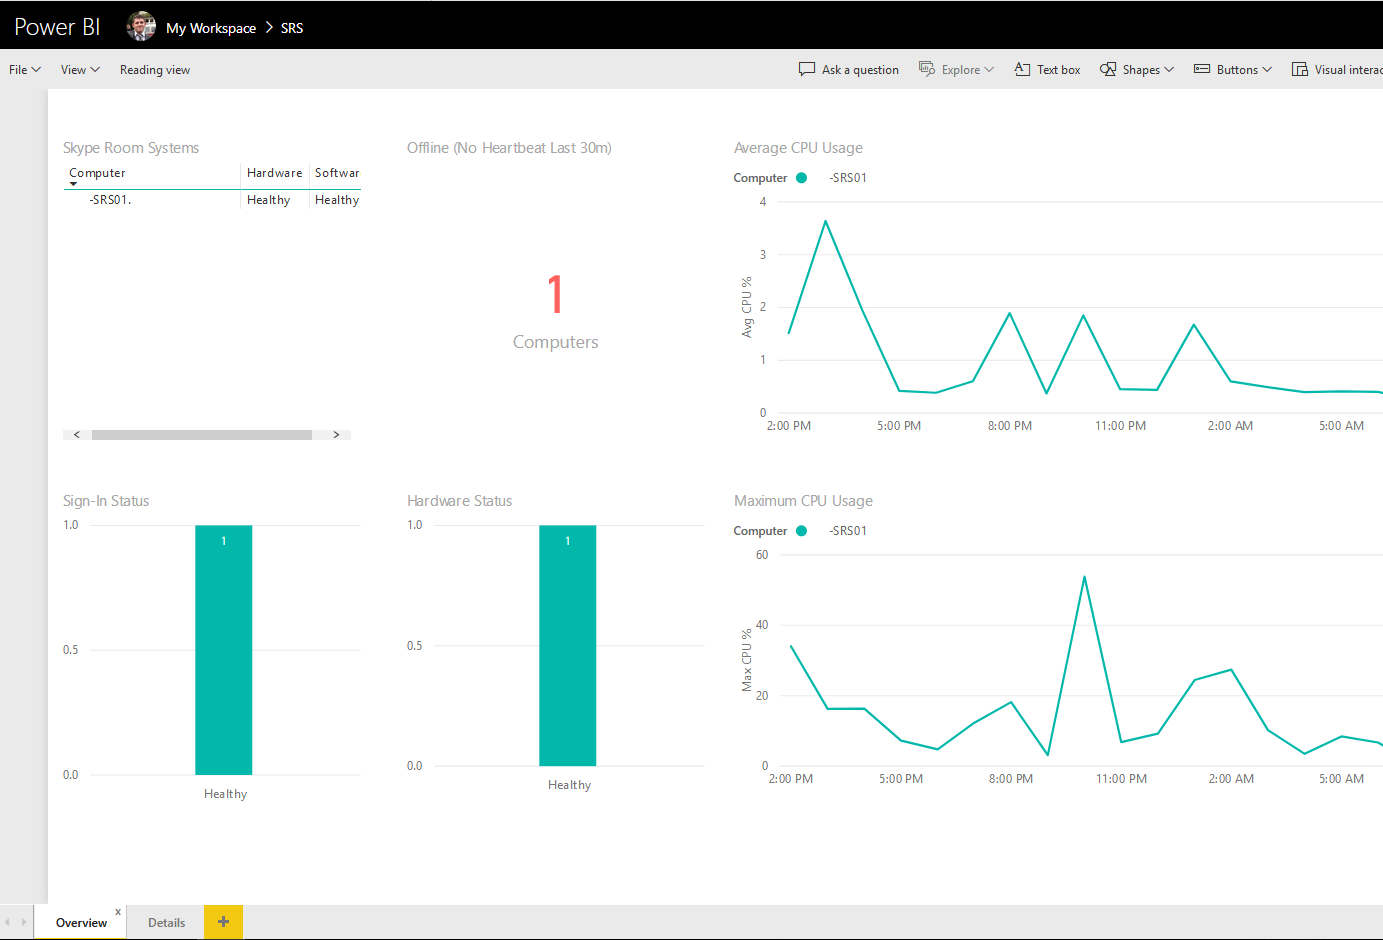
Overview - Here I have an overview of all SRS (in my case, just 1 currently) listing:
- Hardware status - Is everything OK and plugged in?
- Software status - Is it signed in to SfB and Exchange?
- Total SRS that is showing offline (no heartbeat in last 30 minutes)
- CPU usage - Useful to see if CPU is causing a bottleneck on a call
-
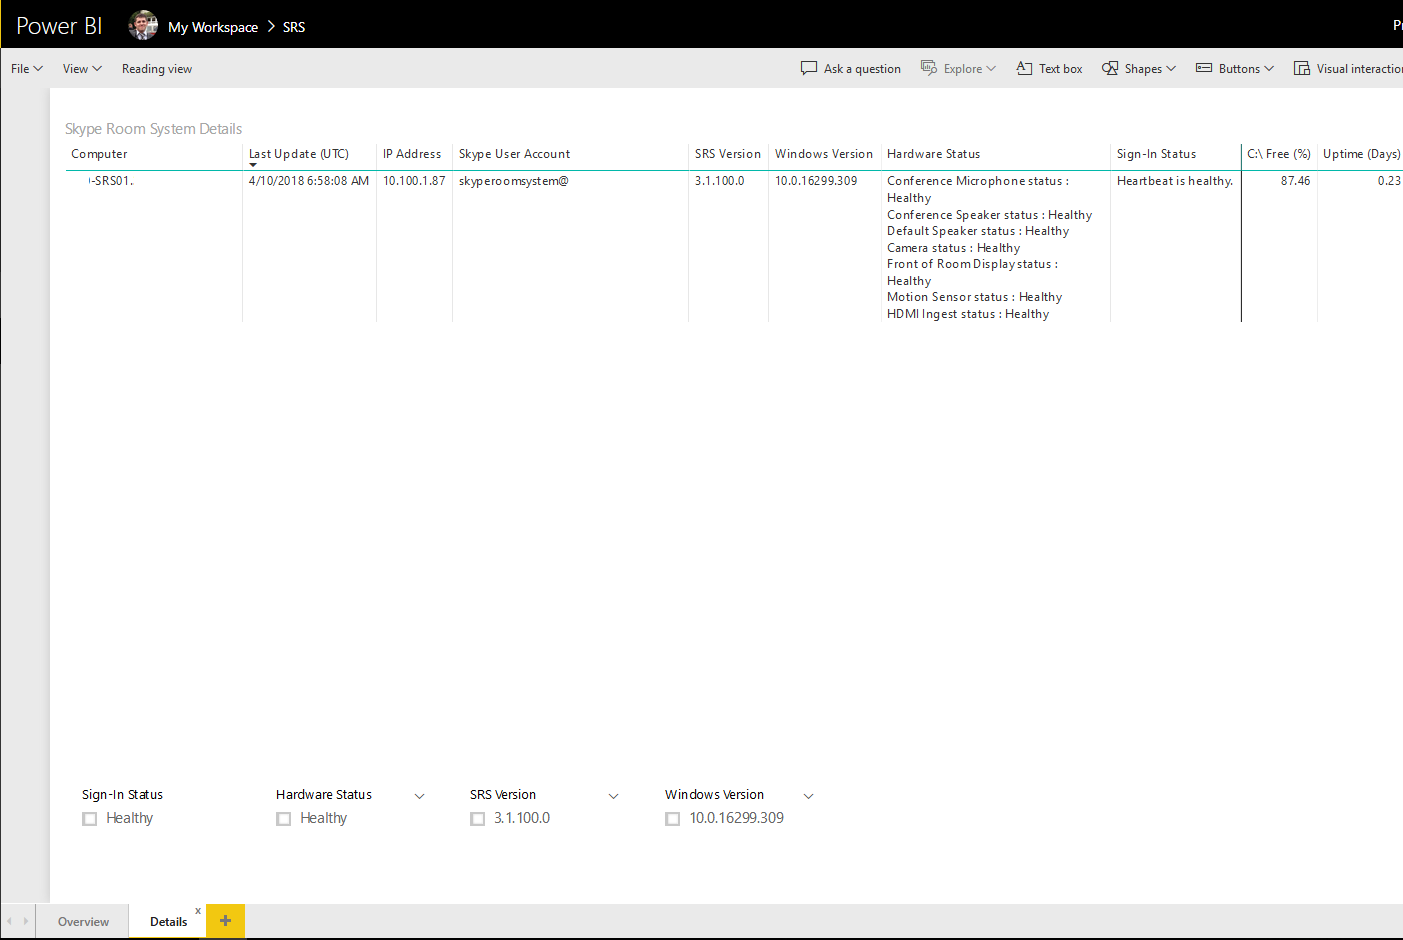
Details - Here I’ve listed all SRS again, but provided filters to filter down on whether it is healthy or unhealthy, what SRS version or what Windows version. Each SRS reports its:
- Current IP address - Maybe it’s set via DHCP and you need to access it via RDP?
- Last update - Last timestamp it sent an update (in UTC) - How long ago did it call home?
- Skype user account - Is the correct user account signed in to the device?
- SRS version - Is it up-to-date?
- Windows version - Again, is it up-to-date?
- Hardware status - More detailed information on each peripheral, is something unplugged?
- Sign-In status - Is the device signed in to SfB but not Exchange or both?
- C:\ free - Is the C drive running low on space causing an issue?
- Uptime - Has it not rebooted in a while? Maybe worth rebooting if issues are reported
Obviously, the reports are a little bare with only one SRS, but you could see how monitoring multiple SRS at a glance could be very useful.
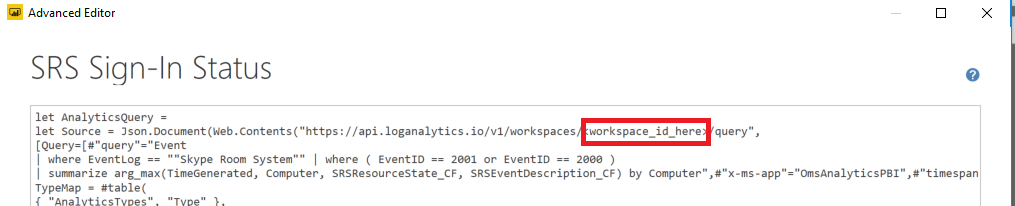
I’ve provided the Power BI desktop file with these reports. You will need to edit each Analytics Query and enter your own OMS workspace ID (the same one used when installing the agents) to get data:
Wrap Up
So let’s recap, we’ve deployed an OMS workspace, installed the agent on the SRS, gathered data from OMS and reported on it in OMS and Power BI. From here we can get a good glance at the health of all SRS across an estate without having to log in to each SRS.
Hope this helps.